Why invest in infrastructure in 2024?
As the world’s population continues to grow and urbanize, there’s an increasing demand to expand and update the infrastructure of many cities in both developing and developed countries. Long-term structural drivers of this demand spans multiple sectors including energy, industrials, utilities, and Infratech to support their growing economies and populations. Private equity and pension plans have allocated capital to infrastructure investments for over a decade. Retail investors seeking long-term growth and income have begun to follow their lead.
Infrastructure attributes
Infrastructure assets tend to be long-lived and capital intensive and provide essential services for the efficient functioning of global economies.
Benefits of infrastructure assets:
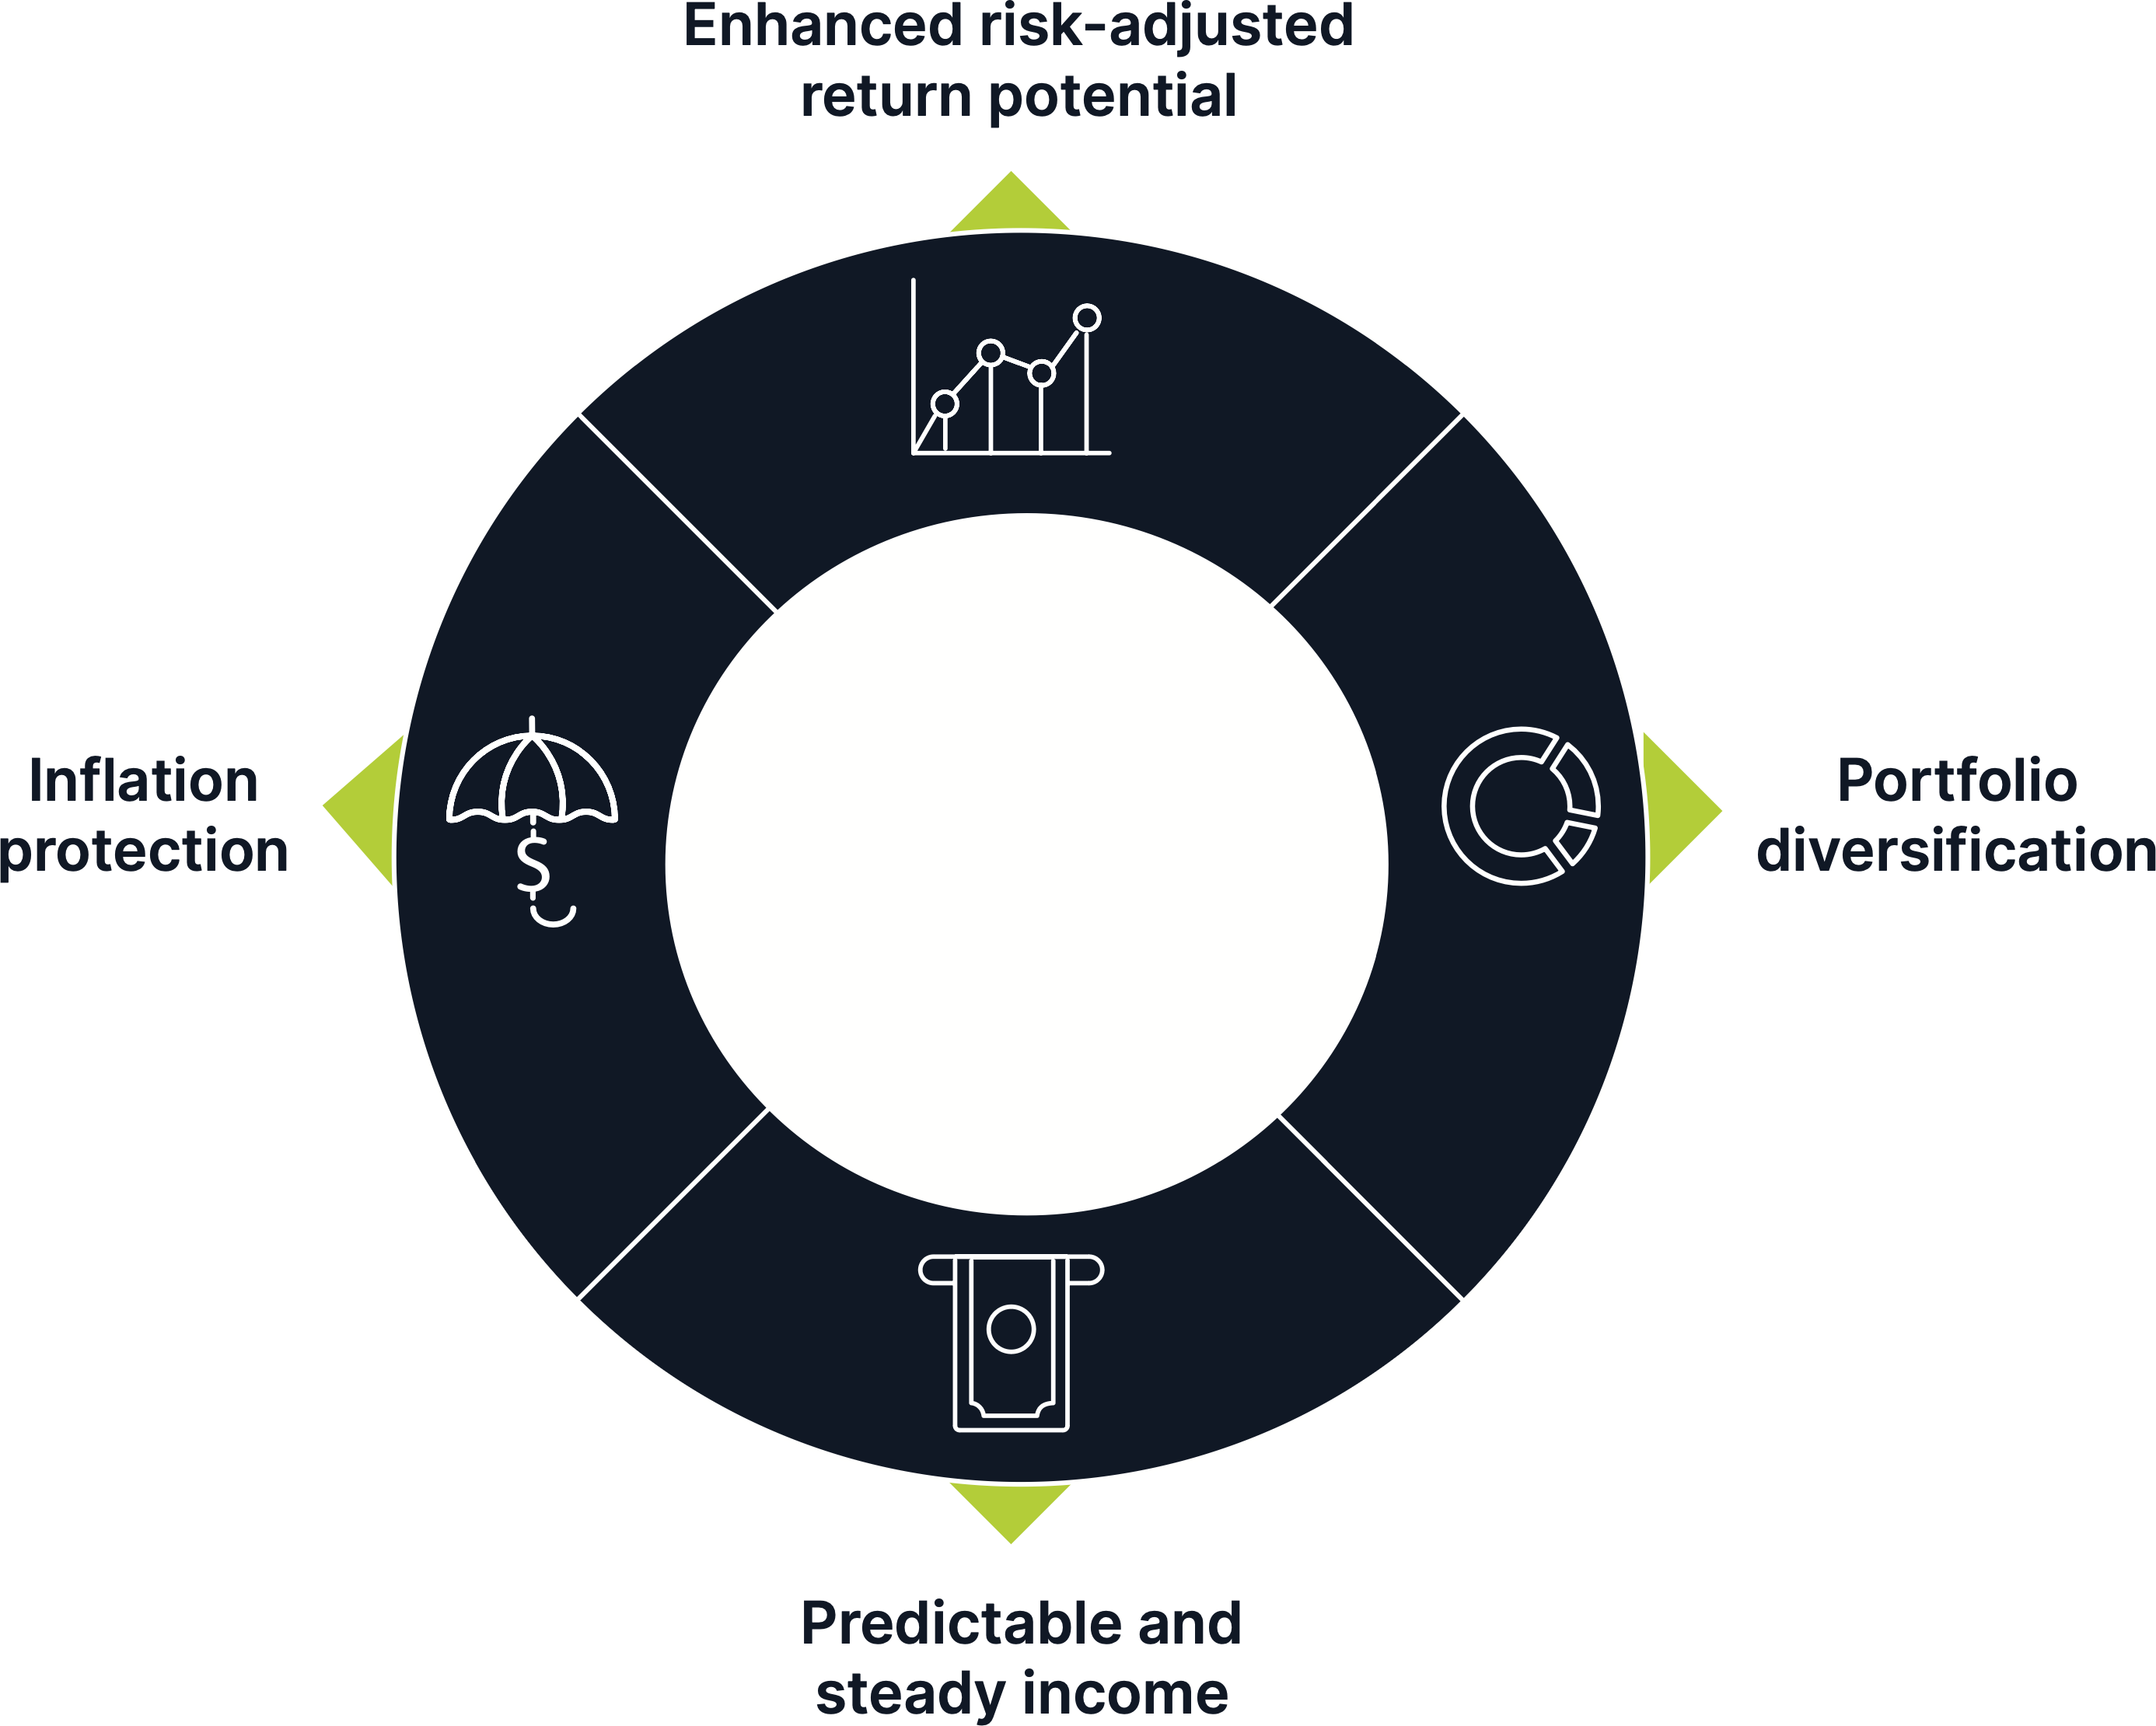
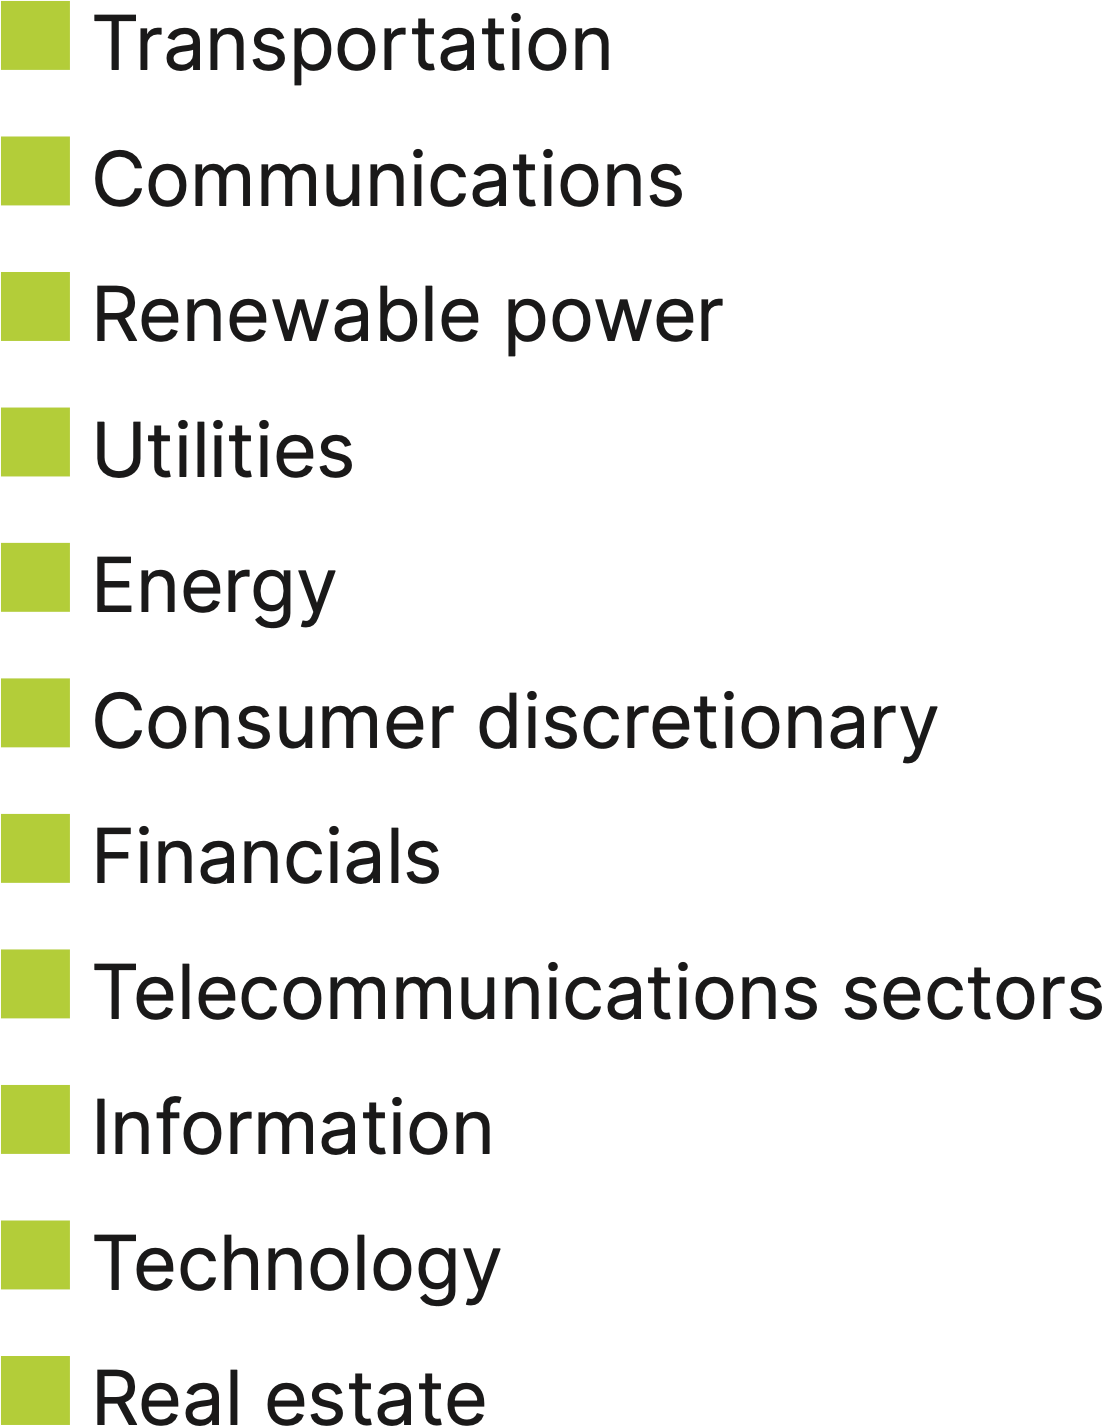
Subsectors:
Infrastructure benefits
Enhanced risk-adjusted return potential 
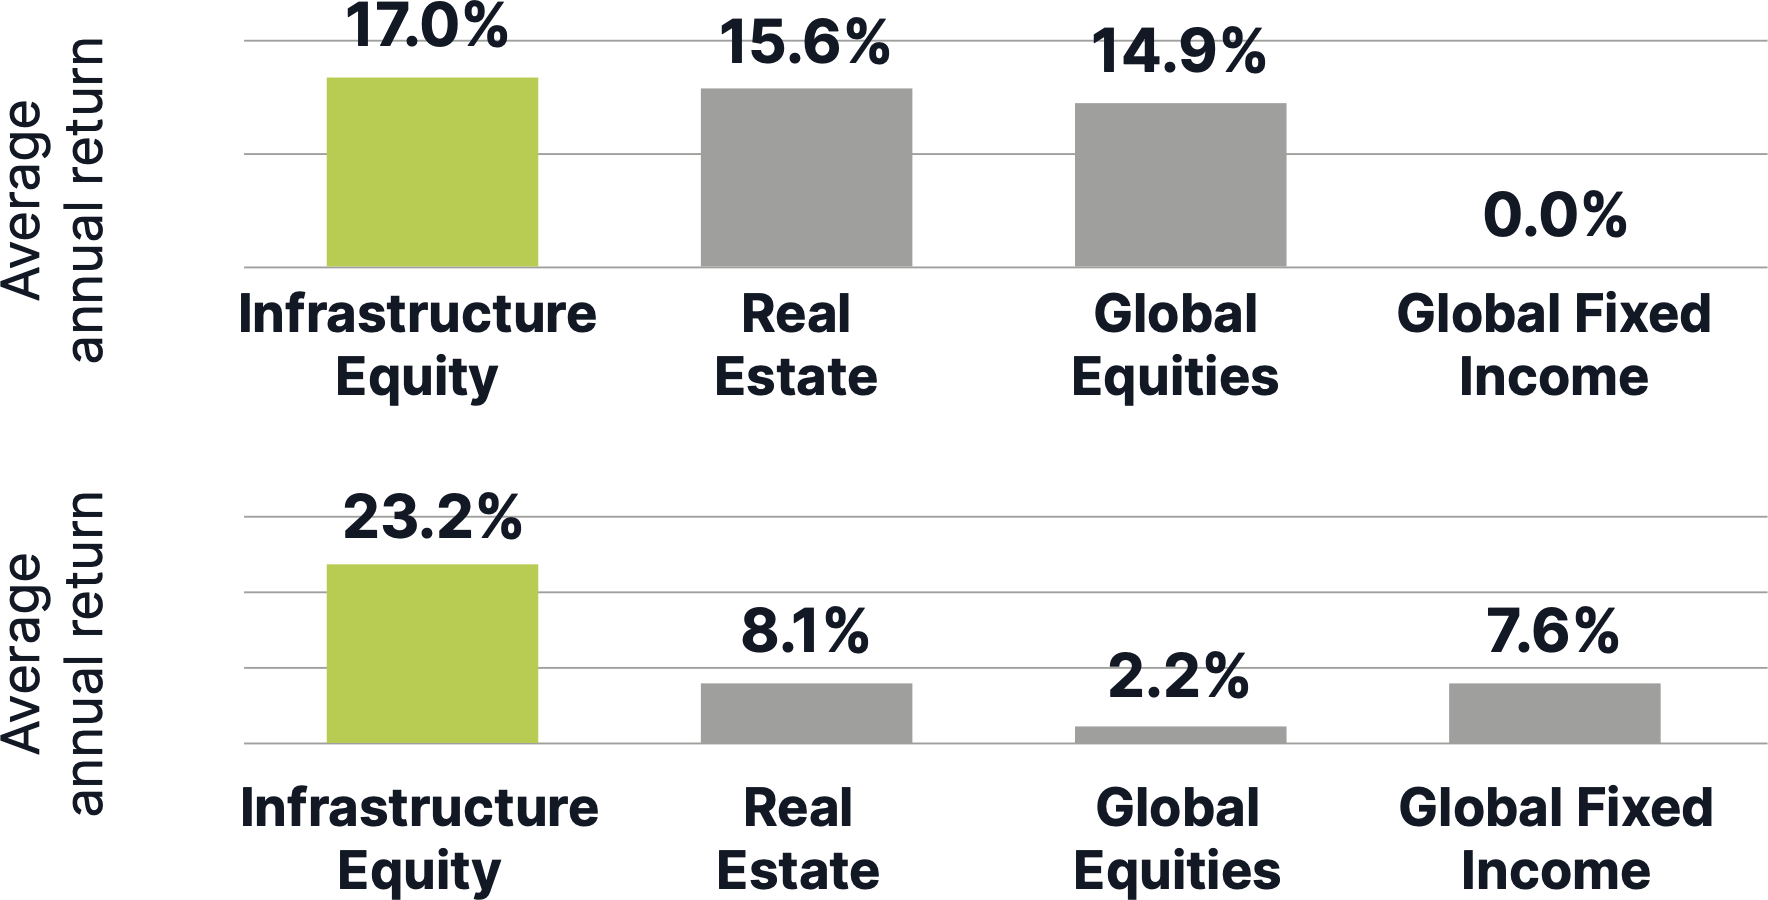
Historically, global infrastructure securities have delivered higher total returns than global equities and global bonds during high inflationary environments. The strong operational leverage in most infrastructure firms’ business models, combined with high barriers to entry produce sustainable, long-term returns in the form of attractive dividend income and capital appreciation.
Average Annual Return in High Growth/High Inflation and Low Growth/High Inflation Environments
High growth / high inflation
High growth / high inflation
Past performance is not indicative of future results. There can be no assurance that past performance will be replicated.
Source: Blackrock, Adding structure to your portfolio with infrastructure, 2023.
Source: Blackrock, Adding structure to your portfolio with infrastructure, 2023.
Portfolio diversification 
Historically, the performance of infrastructure securities has exhibited low correlation with other asset classes1. This means that adding infrastructure securities to a portfolio should enhance diversification and result in the portfolio generating higher returns for the same amount of risk.
Infrastructure Correlations July 2001 – September 2022
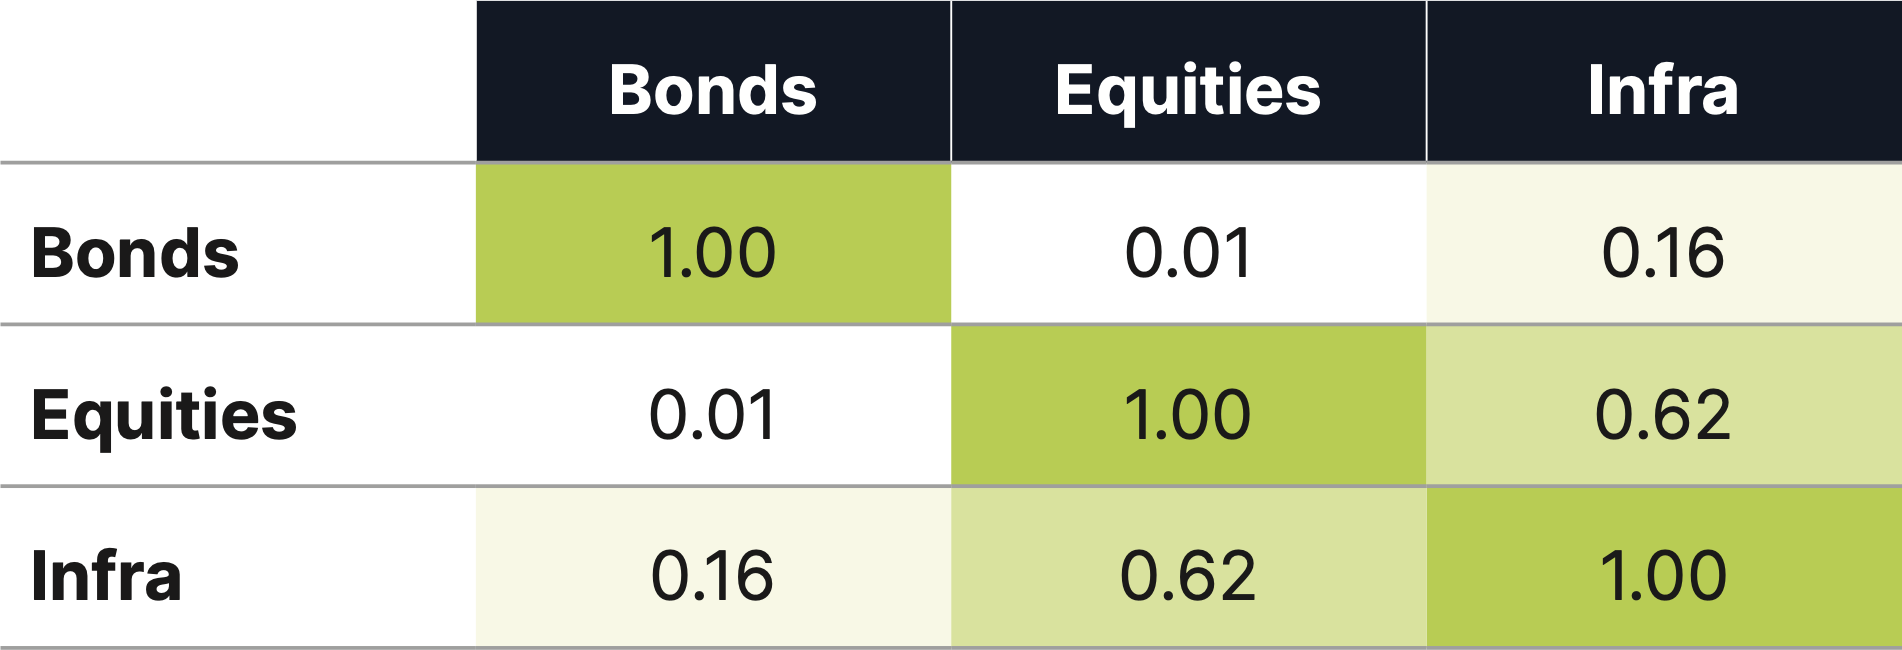
1Correlation measures the extent to which two items move in the same direction. A correlation value of 1 means two items move closely in the same direction, while 0 means they do not move closely at all in either direction, and -1 means the items move in opposite directions.
Past performance is not indicative of future results. There can be no assurance that past performance will be replicated.
Source: Blackrock, Adding structure to your portfolio with infrastructure, 2023.
Past performance is not indicative of future results. There can be no assurance that past performance will be replicated.
Source: Blackrock, Adding structure to your portfolio with infrastructure, 2023.
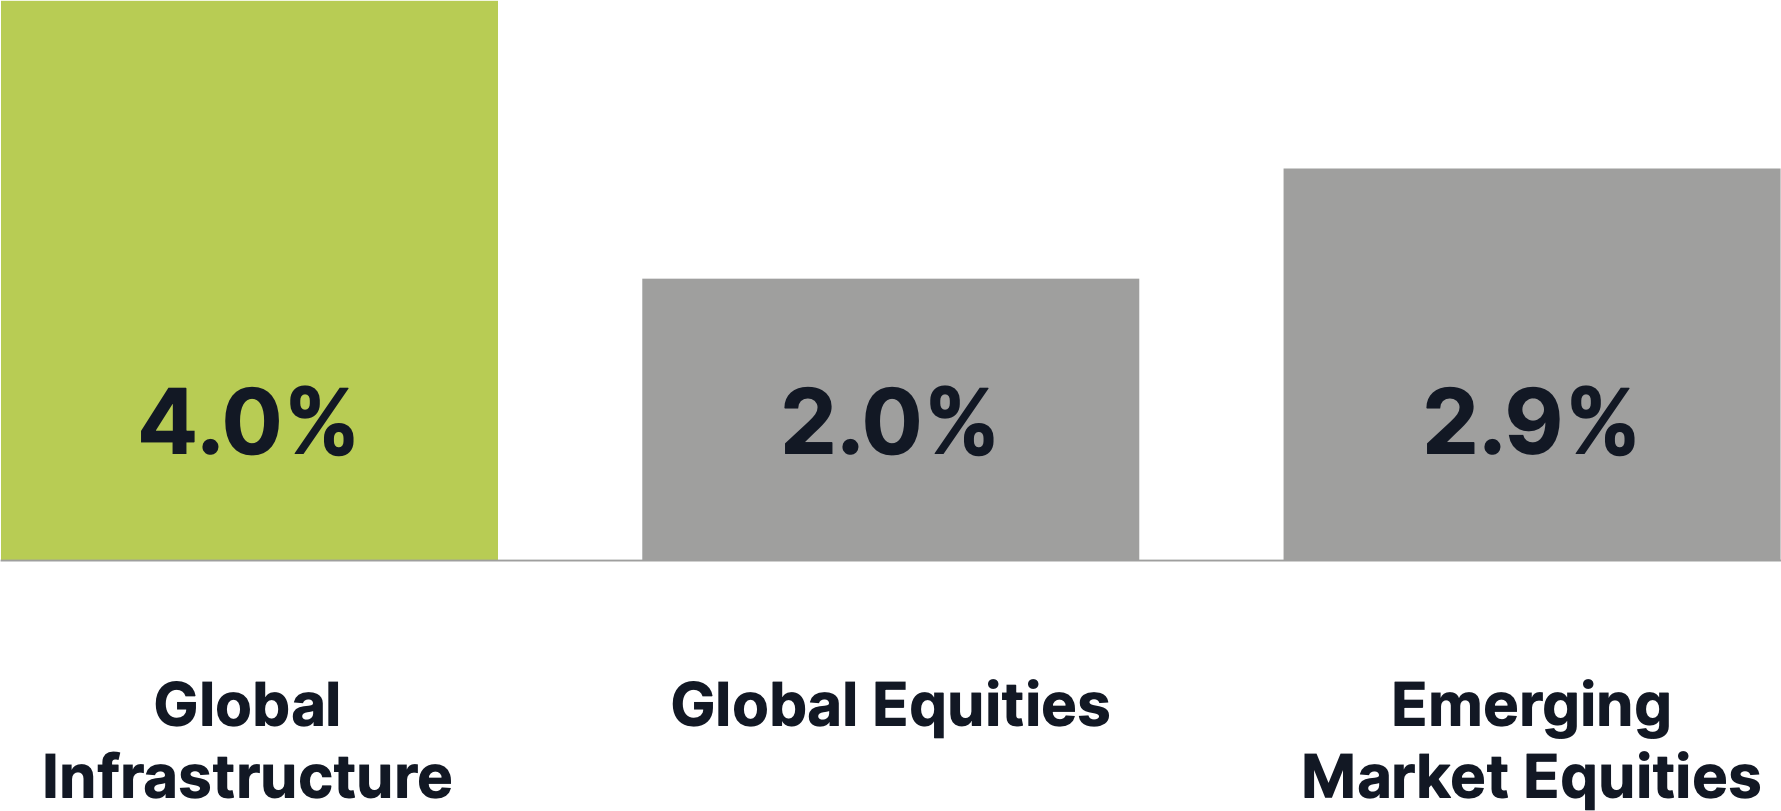
Predictable and steady income 
Many infrastructure assets operate as government- regulated monopolies and, as a result, enjoy high barriers to entry. These monopolies have lasted for decades and can produce consistent cash flow and dividends that are positively levered to economic growth.
Dividend Yield Comparison
Past performance is not indicative of future results. There can be no assurance that past performance will be replicated.
Source: Starlight Capital, Bloomberg, dividend yield as of December 8, 2023. Global Infrastructure, Global Equities, and Emerging Market Equities figures are represented by the following respective indices: S&P Global Infrastructure Index, MSCI World Index, and MSCI Emerging Markets Index.
Source: Starlight Capital, Bloomberg, dividend yield as of December 8, 2023. Global Infrastructure, Global Equities, and Emerging Market Equities figures are represented by the following respective indices: S&P Global Infrastructure Index, MSCI World Index, and MSCI Emerging Markets Index.
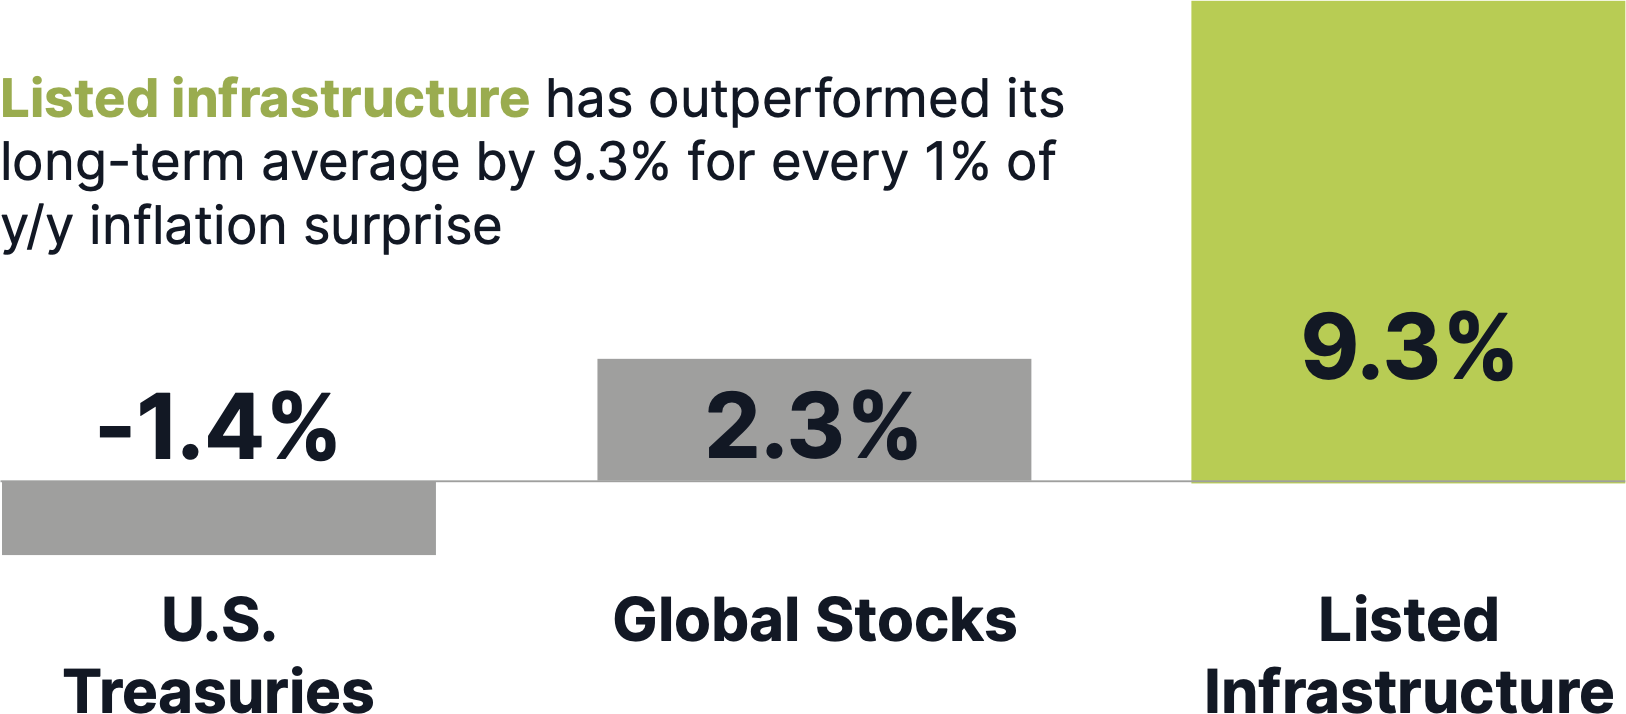
Inflation protection 
Revenues for many infrastructure assets are tied directly to inflation, providing a natural hedge and real long-term returns. For other infrastructure assets, such as water and electricity utilities, the necessity of their services generates strong revenue and cash flow growth over the long term as consumers absorb price increases.
Strong Relative Returns in Inflationary Periods
Inflation beta, June 1991-June 2023
Past performance is not indicative of future results. There can be no assurance that past performance will be replicated.
Source: Cohen & Steers, Bloomberg, Refinitiv, U.S. Bureau of Labor Statistics. As at June 30, 2023. Past performance is no guarantee of future results. Inflation beta is the linear regression beta of 1-year real returns to the difference between the y/y realized inflation rate (U.S. CPI) and lagged 1-year-ahead expected inflation (median inflation expectation from Univ. of Michigan Survey of 1-year-ahead inflation expectations), including the level of the lagged expected inflation rate.
Source: Cohen & Steers, Bloomberg, Refinitiv, U.S. Bureau of Labor Statistics. As at June 30, 2023. Past performance is no guarantee of future results. Inflation beta is the linear regression beta of 1-year real returns to the difference between the y/y realized inflation rate (U.S. CPI) and lagged 1-year-ahead expected inflation (median inflation expectation from Univ. of Michigan Survey of 1-year-ahead inflation expectations), including the level of the lagged expected inflation rate.
Why invest in infrastructure in 2024?
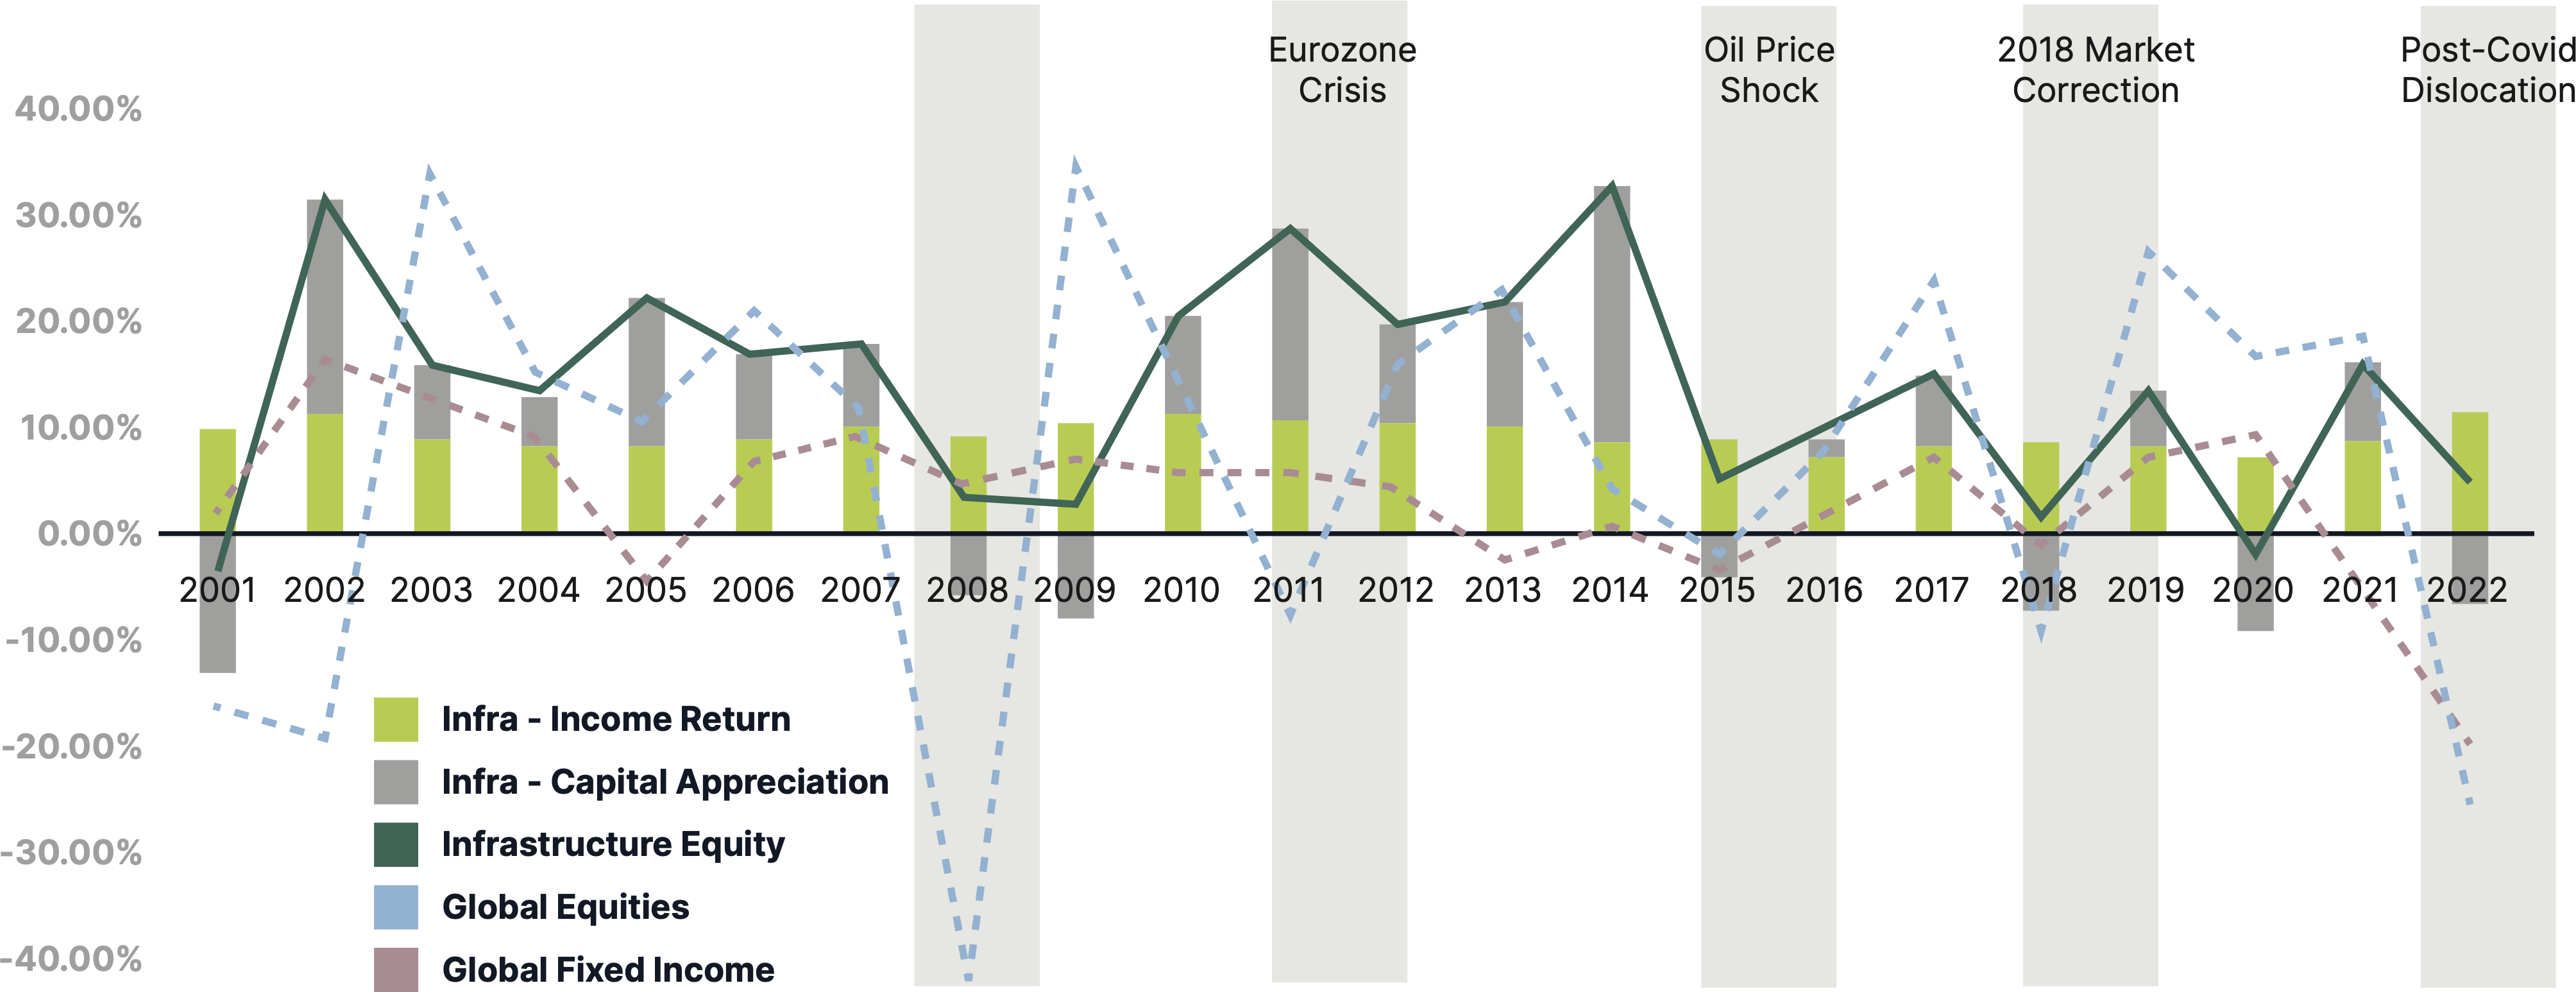
Resilient returns and stable income over time
Historically, infrastructure assets have delivered a consistent income and a return premium relative to public equities and fixed income across various market cycles.
Historically, infrastructure assets have delivered a consistent income and a return premium relative to public equities and fixed income across various market cycles.
Infrastructure Returns (2001-2022)
Past performance is not indicative of future results. There can be no assurance that past performance will be replicated.
Source: Blackrock, Adding structure to your portfolio with infrastructure, 2023.
Source: Blackrock, Adding structure to your portfolio with infrastructure, 2023.
A period of elevated yet declining inflation
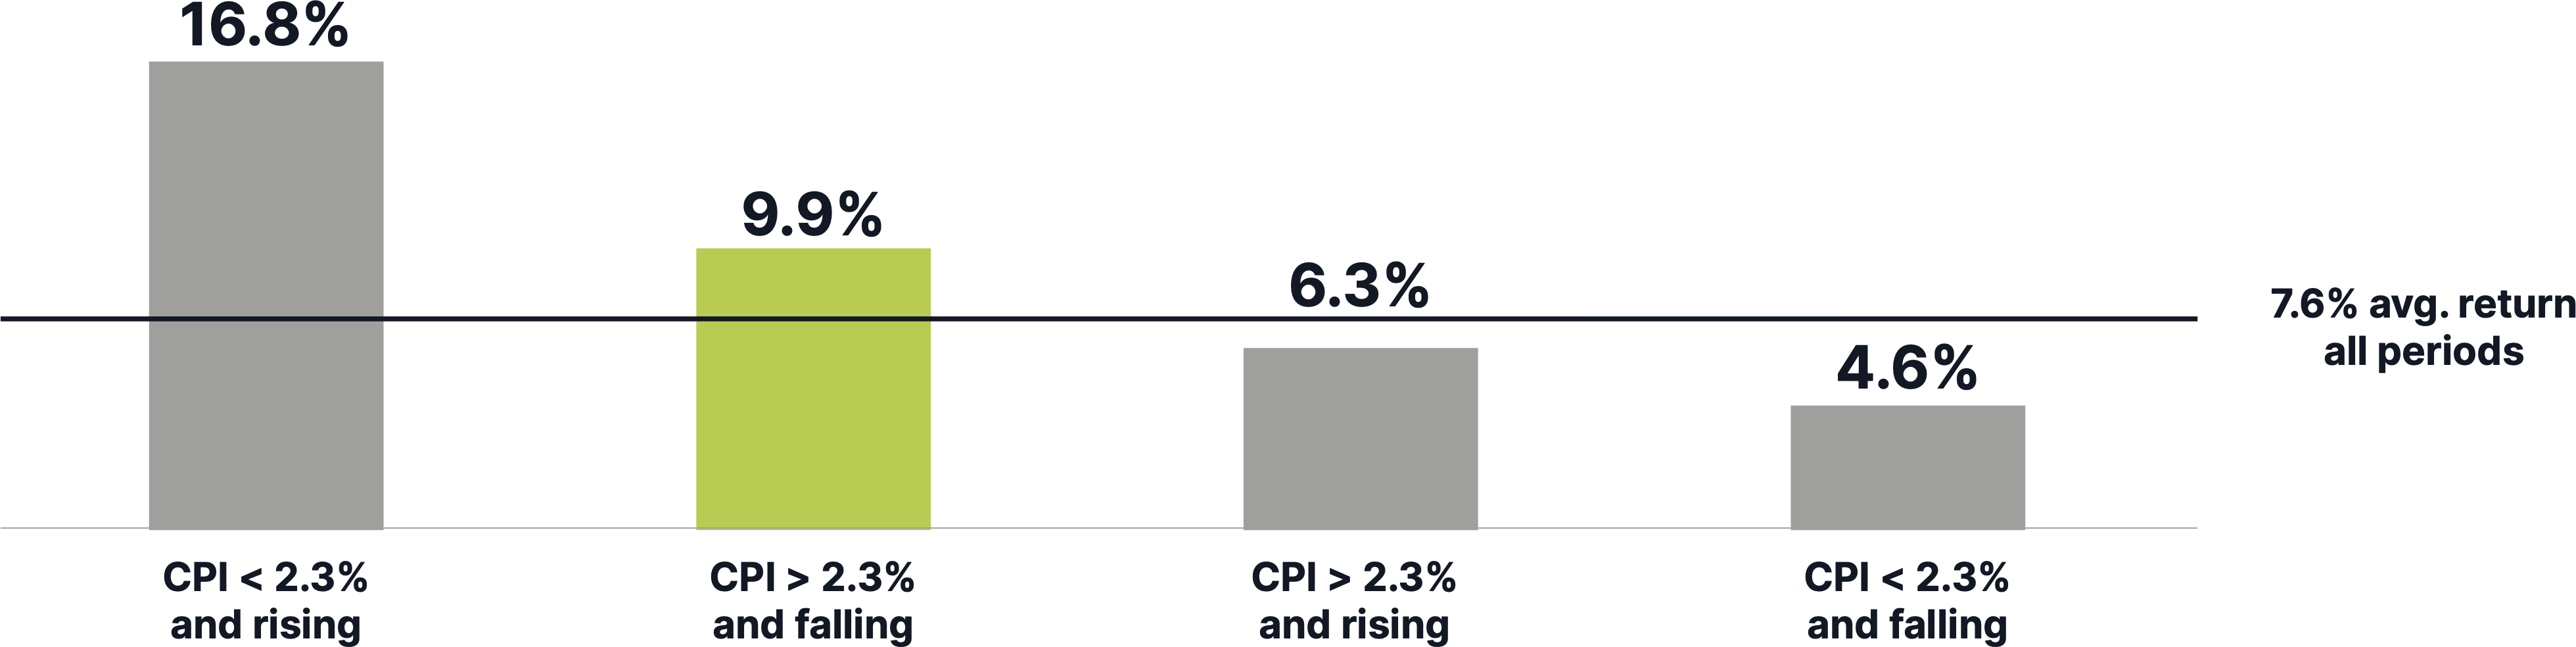
In the aftermath of the challenging inflation and interest rate shocks in 2022 and 2023, the global economy is in transition. While inflation is showing signs of abatement, projections indicate it will persist above trend in 2024. Infrastructure firms’ inflation protection mechanism in their pricing structures should remain supportive of the asset class. Notably, historical data indicates that listed infrastructure has produced above-average returns during periods of elevated yet declining inflation—paralleling the current economic landscape. This underscores the value of an infrastructure allocation as a portfolio inflation hedge.
In the aftermath of the challenging inflation and interest rate shocks in 2022 and 2023, the global economy is in transition. While inflation is showing signs of abatement, projections indicate it will persist above trend in 2024. Infrastructure firms’ inflation protection mechanism in their pricing structures should remain supportive of the asset class. Notably, historical data indicates that listed infrastructure has produced above-average returns during periods of elevated yet declining inflation—paralleling the current economic landscape. This underscores the value of an infrastructure allocation as a portfolio inflation hedge.
Infrastructure has produced above-average returns when inflation was high but moderating
Infrastructure average 1-year real return (Jan. 1973-Mar. 2023)
Infrastructure average 1-year real return (Jan. 1973-Mar. 2023)
Past performance is not indicative of future results. There can be no assurance that past performance will be replicated.
Source: Cohen & Steers, Refinitiv Datastream. As at March 31, 2023. Data quoted represents past performance, which is no guarantee of future results.
Source: Cohen & Steers, Refinitiv Datastream. As at March 31, 2023. Data quoted represents past performance, which is no guarantee of future results.
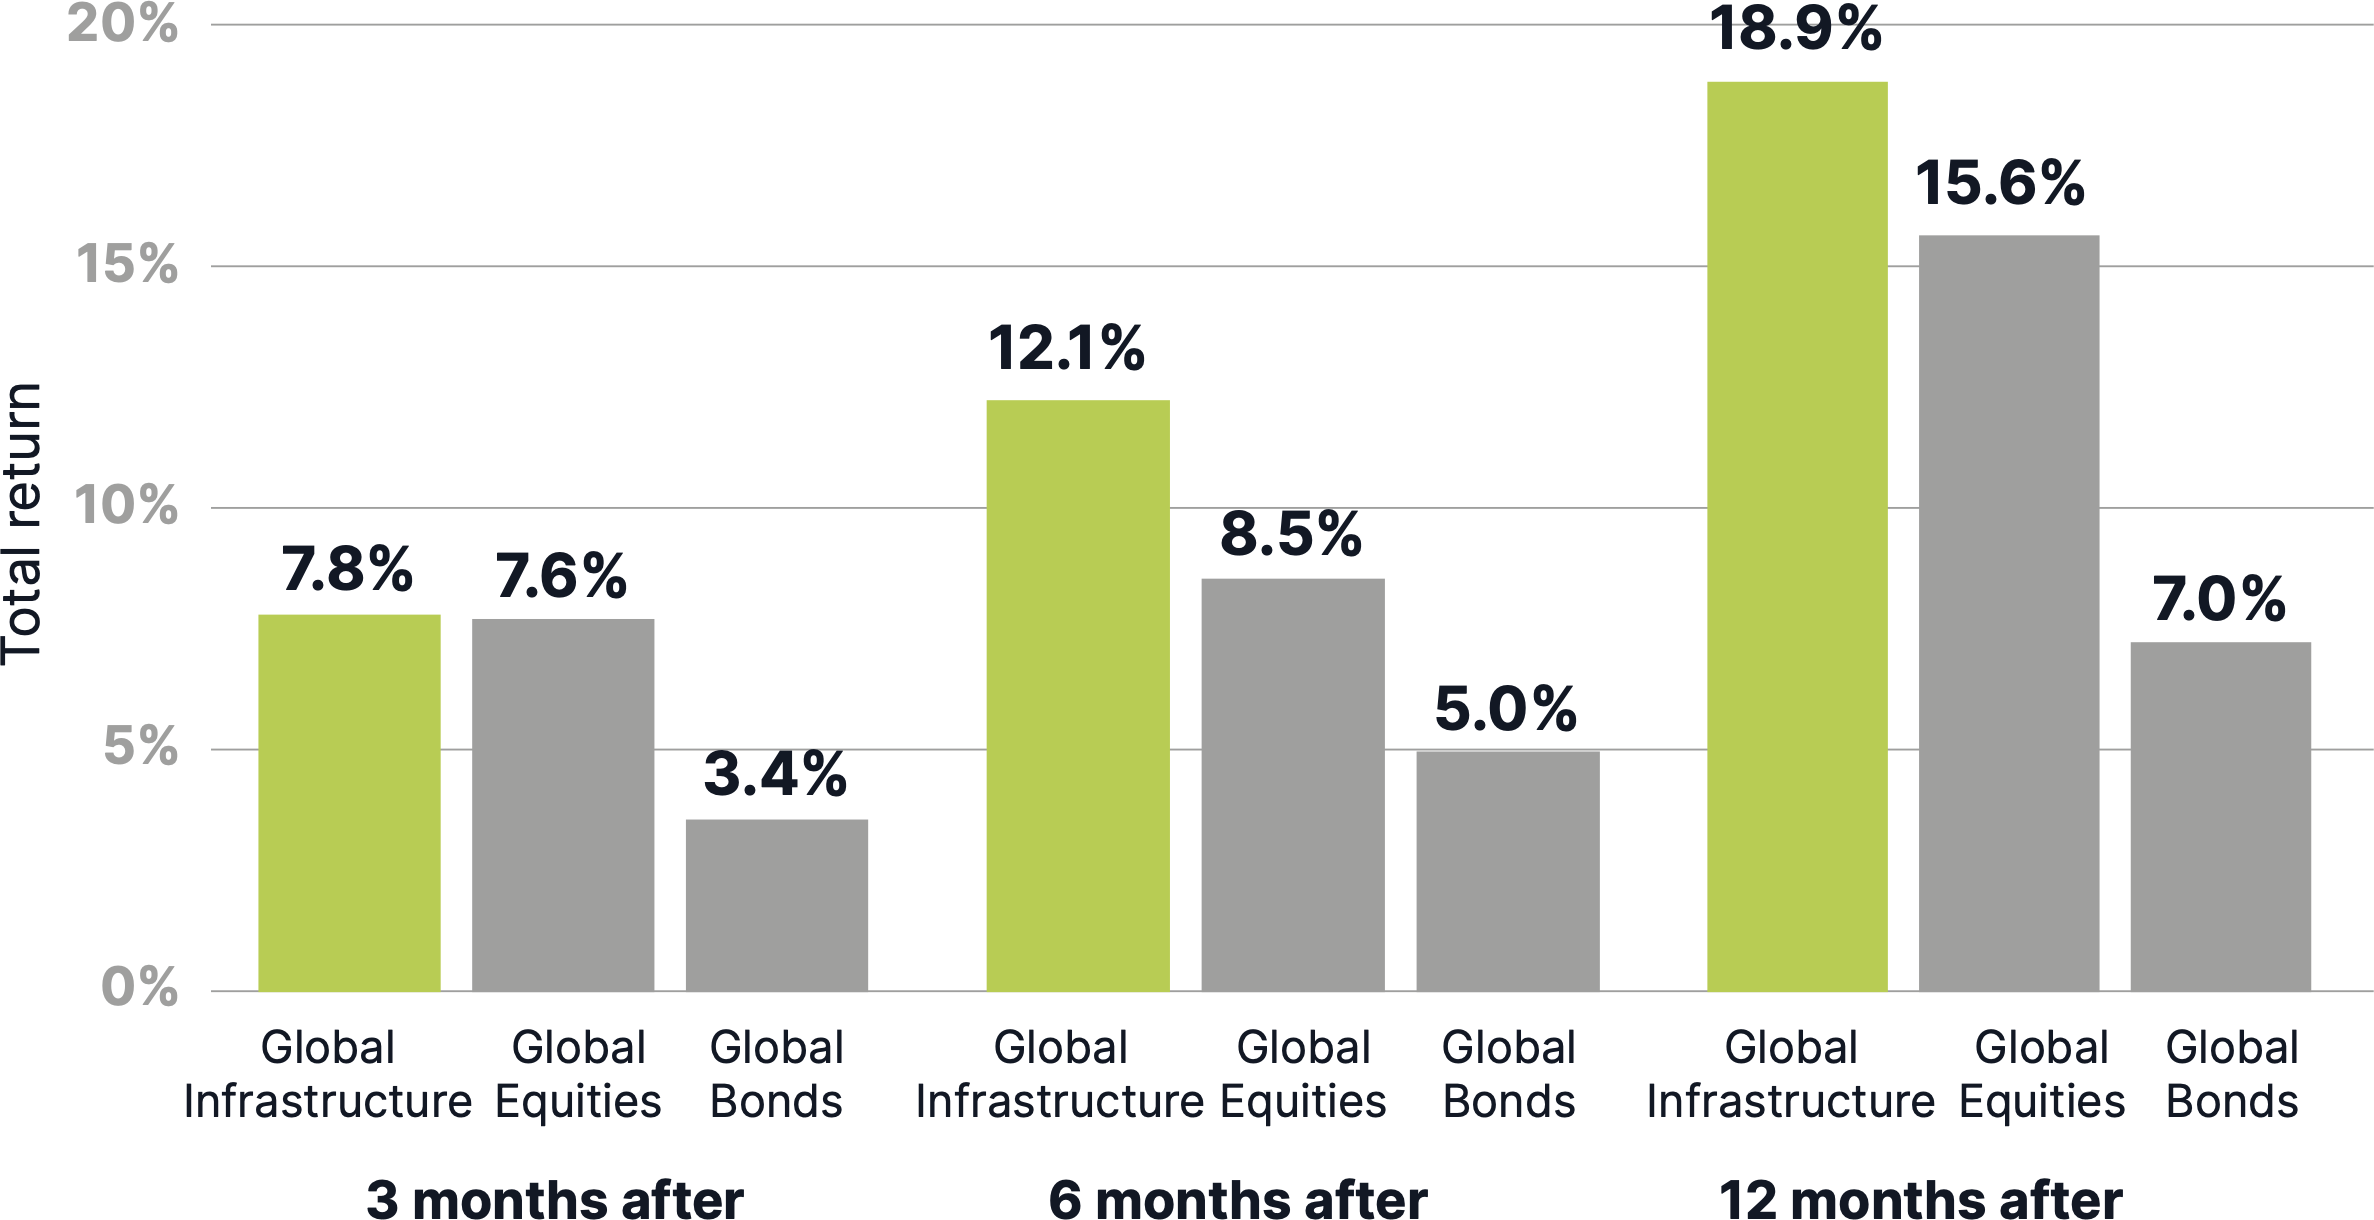
Infrastructure outperformance following rate hike cycles
An easing interest rate environment causes infrastructure companies to over-earn their allowed returns and lowers their hurdle rates, increasing the potential for accretive growth projects and incremental growth in capital returns. Even the signaling of a pause in the interest rate hiking cycle can be a powerful catalyst for infrastructure outperformance. The graph below shows outperformance of the asset class over periods of three, six and 12 months following a tightening cycle.
An easing interest rate environment causes infrastructure companies to over-earn their allowed returns and lowers their hurdle rates, increasing the potential for accretive growth projects and incremental growth in capital returns. Even the signaling of a pause in the interest rate hiking cycle can be a powerful catalyst for infrastructure outperformance. The graph below shows outperformance of the asset class over periods of three, six and 12 months following a tightening cycle.
Past performance is not indicative of future results. There can be no assurance that past performance will be replicated.
Source: CBRE, The Starting Line: Listed Infrastructure ready to run, 2023.
Source: CBRE, The Starting Line: Listed Infrastructure ready to run, 2023.
It is often underappreciated that infrastructure does not necessarily require lower rates to produce outperformance – merely stability in the outlook for rates. While a rapid rise in yields impacts earnings temporarily and has historically hindered short-term performance, infrastructure companies are able to adjust to a higher rate environment by filing rate cases to adjust their regulated cost base in order to restore their return profile.
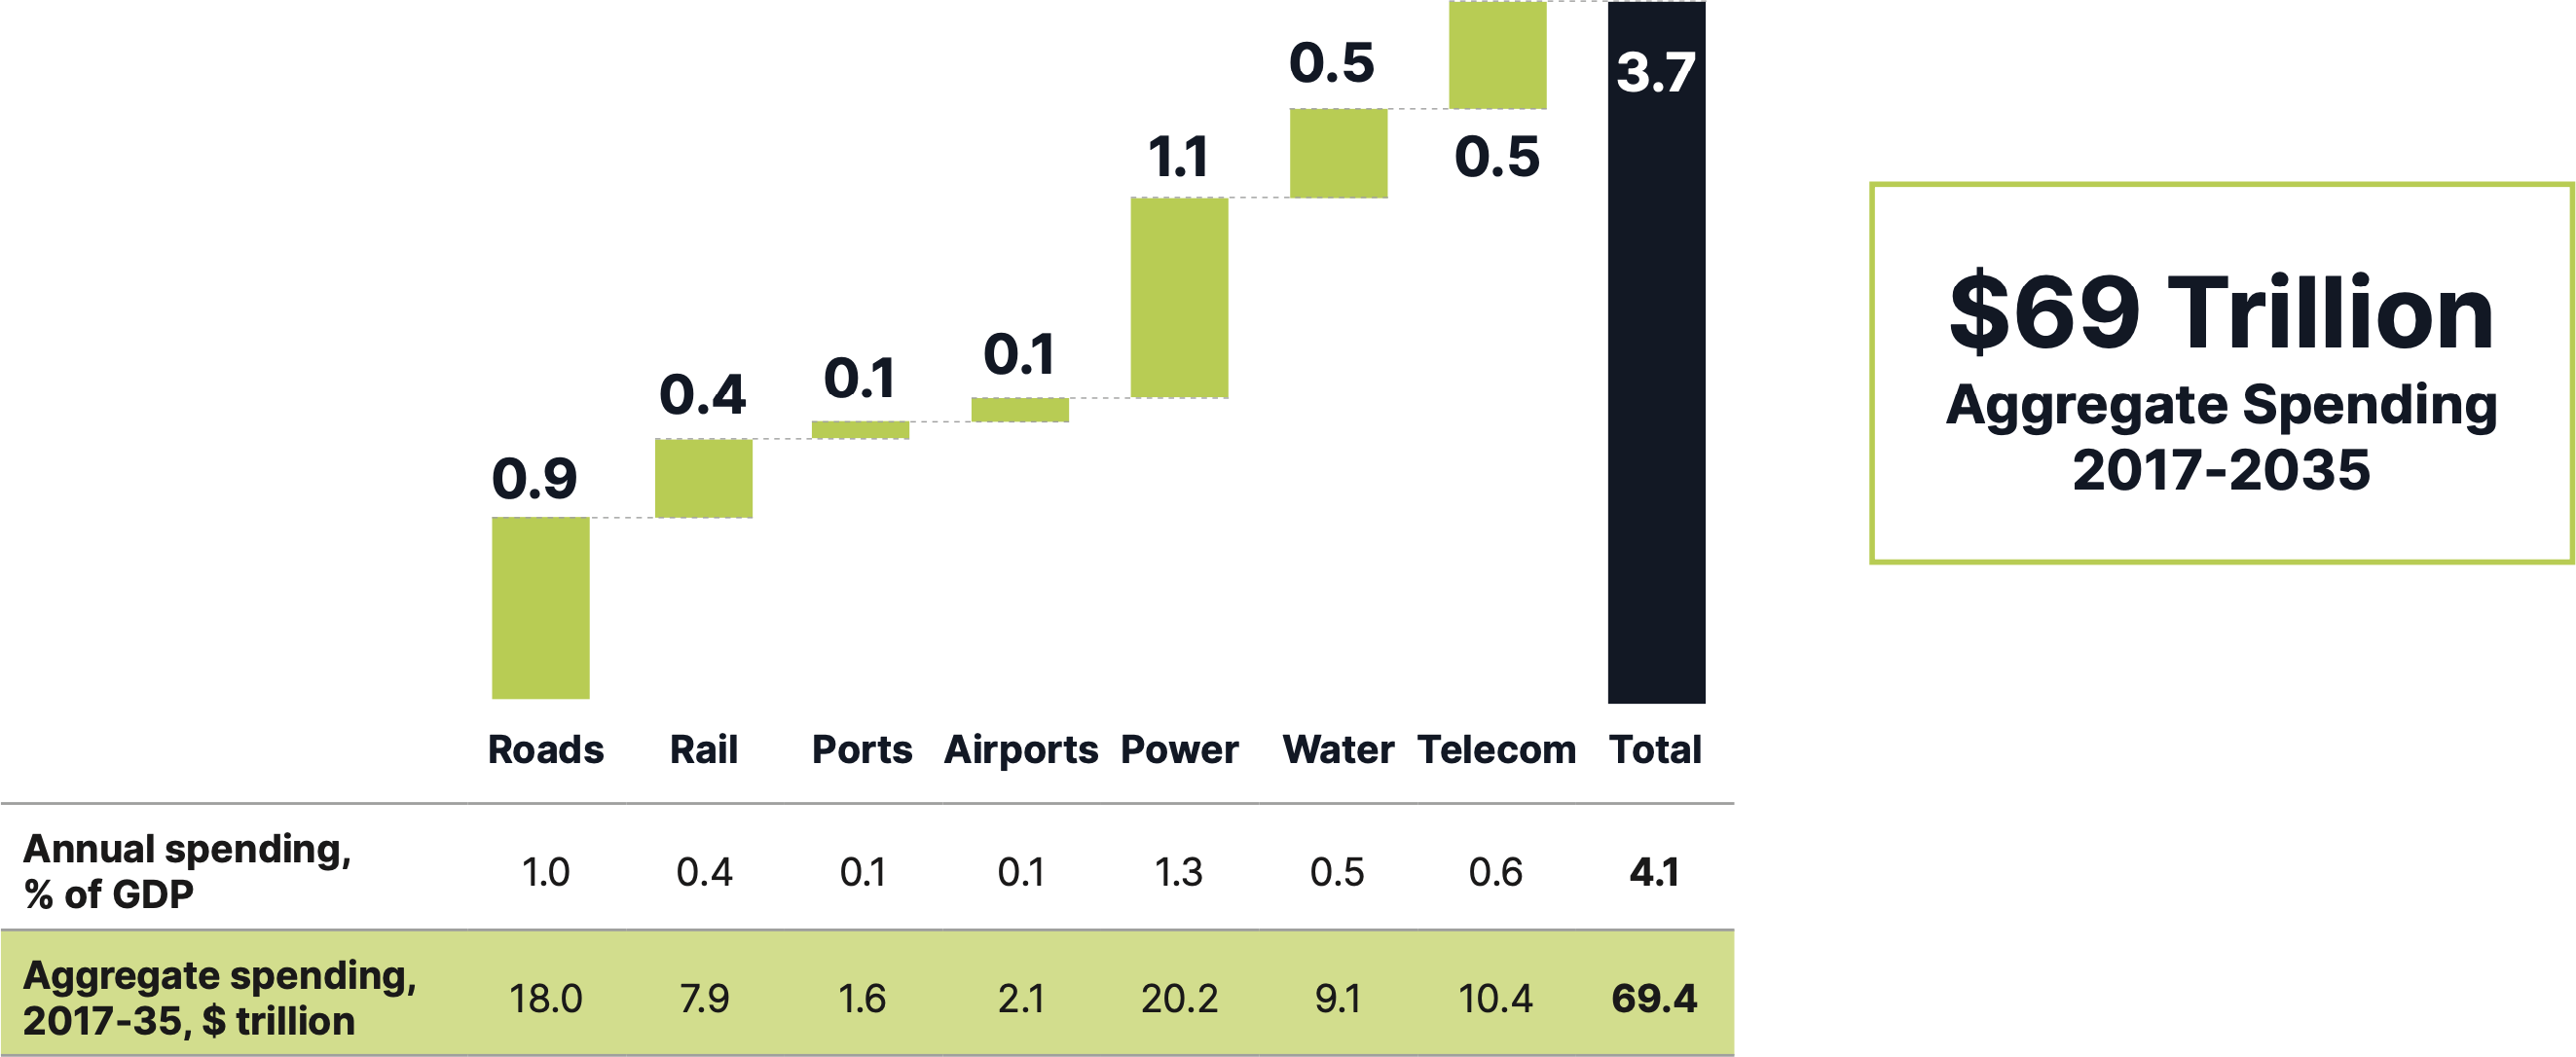
The global economy requires U.S. $69 trillion in infrastructure investment by 2035
Looking at the network infrastructure necessary to support economies—roads, railways, ports, airports, power, water, and telecoms—the world needs to invest US$69 trillion total to 2035 to keep pace with projected GDP growth. This could increase further through renewable energy power generation and development to meet net-zero mandates.
Looking at the network infrastructure necessary to support economies—roads, railways, ports, airports, power, water, and telecoms—the world needs to invest US$69 trillion total to 2035 to keep pace with projected GDP growth. This could increase further through renewable energy power generation and development to meet net-zero mandates.
Average annual need, 2017-35, $ trillion, constant 2017 dollars
There can be no assurance that past performance will be replicated.
Source: McKinsey & Company, Bridging Infrastructure Gaps: Has the world made progress?, October 2017.
Source: McKinsey & Company, Bridging Infrastructure Gaps: Has the world made progress?, October 2017.
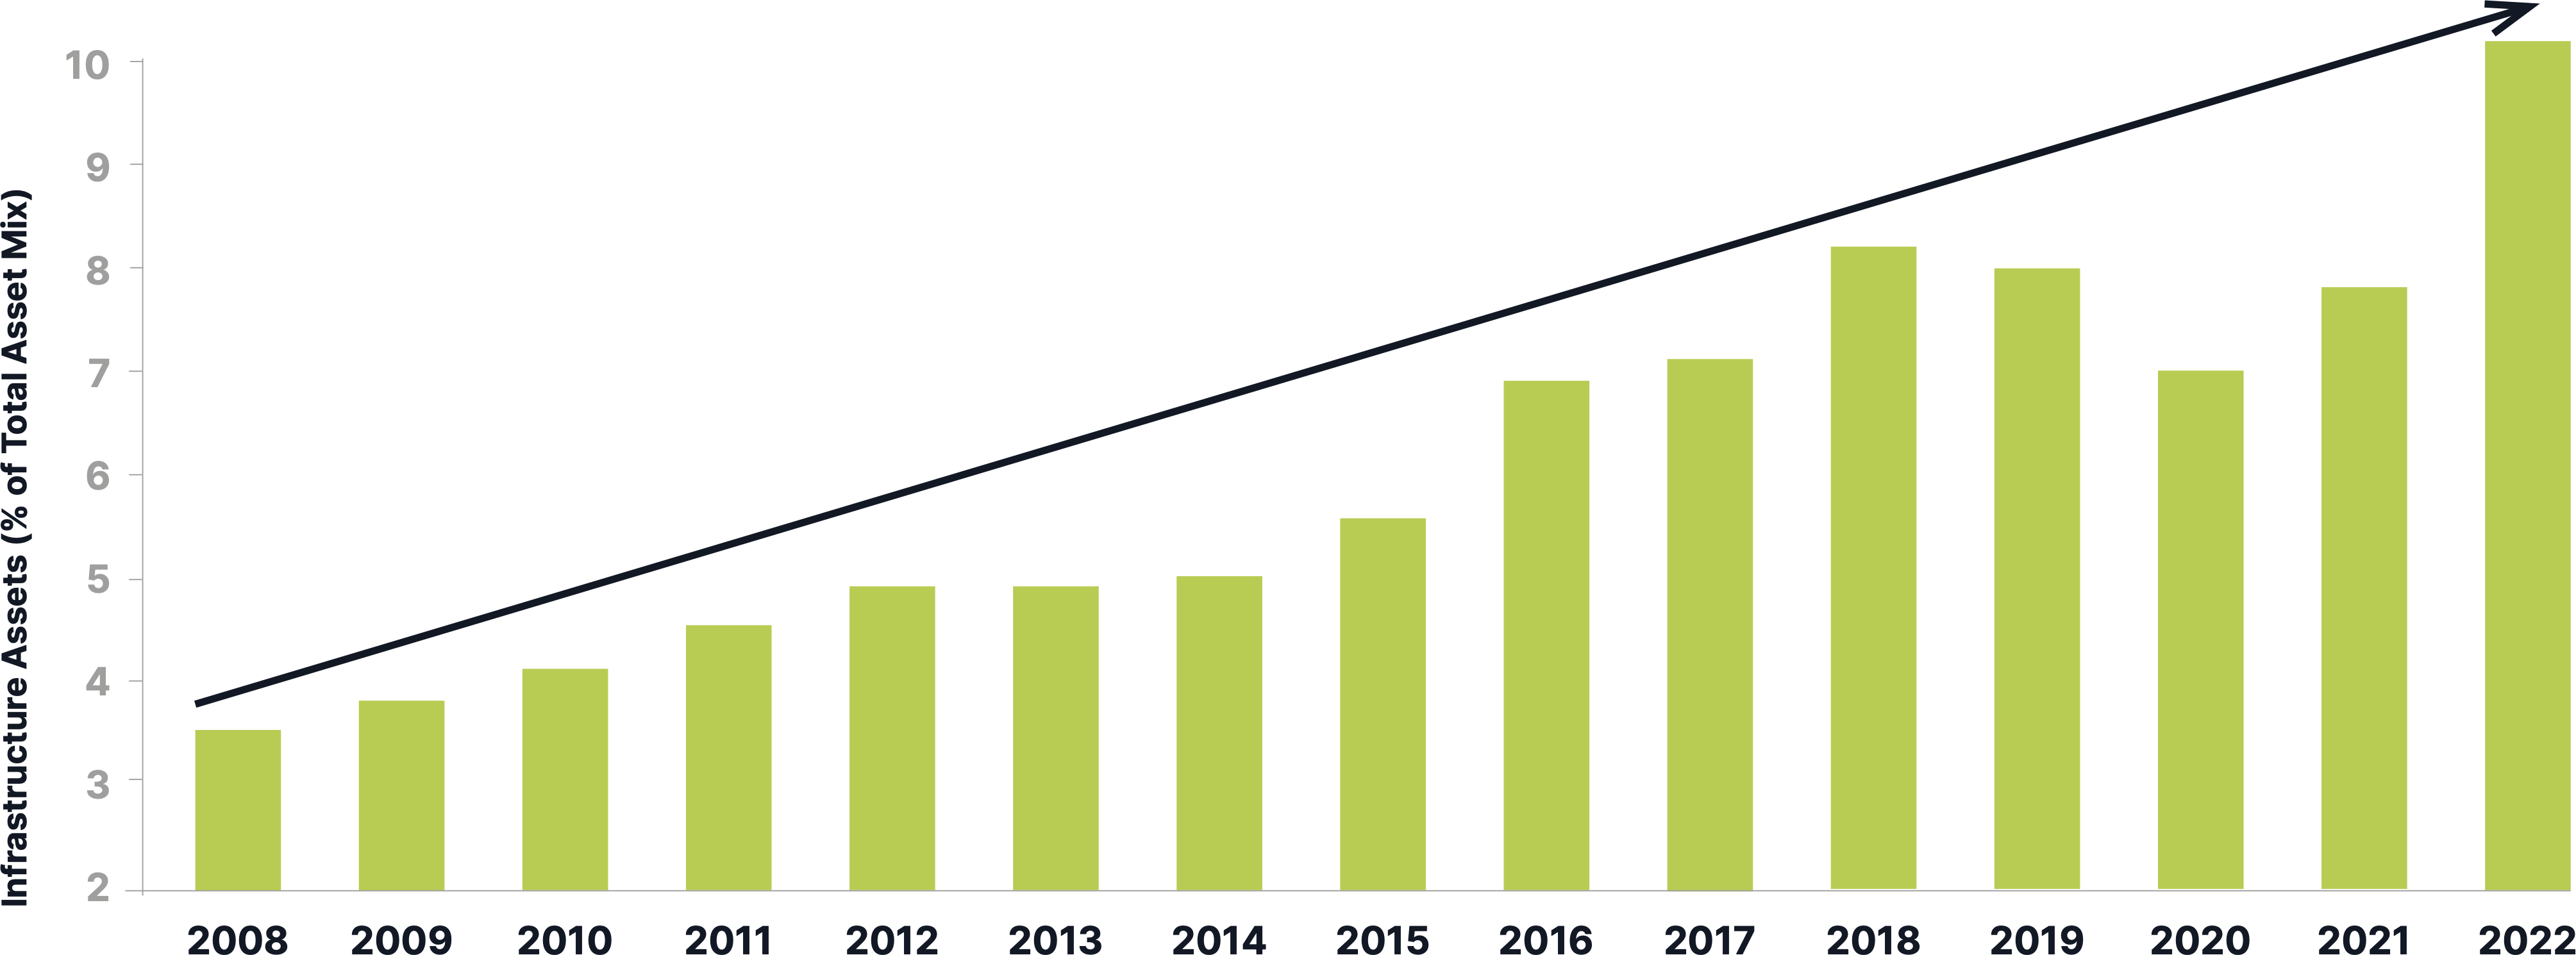
Pension funds increasing infrastructure investments
Large pension funds have continued to increase their allocations to infrastructure. Between 2008 to 2017 the top 100 pension plans in Canada steadily increased their total allocation to infrastructure from approximately $29 billion or 3.59 percent to over $150 billion or 7.11 percent of their combined assets under management (AUM).
Large pension funds have continued to increase their allocations to infrastructure. Between 2008 to 2017 the top 100 pension plans in Canada steadily increased their total allocation to infrastructure from approximately $29 billion or 3.59 percent to over $150 billion or 7.11 percent of their combined assets under management (AUM).
Infrastructure Asset Mix of DB Plans of Sponsor Organizations Infrastructure (% of Total)
There can be no assurance that past performance will be replicated.
Source: Data from December 31, 2008 - December 31, 2022. Pension Investment Association of Canada.
Source: Data from December 31, 2008 - December 31, 2022. Pension Investment Association of Canada.
Access global infrastructure with Starlight Capital
Starlight Capital is an independent Canadian asset management firm with over $1 billion in assets under management. We manage Global and North American diversified private and public equity investments across traditional and alternative asset classes, including real estate, infrastructure and private equity. Our goal is to deliver superior risk-adjusted, total returns to investors through a disciplined investment approach: Focused Business Investing.
Focused Business Investing means we invest in great businesses when they offer us enough return for the risk we are exposed to. Great businesses are characterized by strong recurring cash flow, irreplaceable assets, low leverage, and strong management team. The result is concentrated portfolios of great businesses that reward investors with rising dividends.
Starlight Global Infrastructure Fund is an opportunity to invest in large assets that provide essential services in cities throughout the world.
We invite you to partner with us.
Starlight Capital Mutual Fund and ETF
Starlight Global Infrastructure Fund
Inception—2018
Investment Objective:
To provide regular current income by investing globally in companies with either direct or indirect exposure to infrastructure.
Fund Profile:
Starlight Global Infrastructure Fund - Series ETF (SCGI)
Starlight Global Infrastructure Fund - Series A (SLC102)
Starlight Global Infrastructure Fund - Series T6 (SLC152)
Starlight Global Infrastructure Fund - Series F (SLC202)
Starlight Global Infrastructure Fund - Series FT6 (SLC252)
Starlight Global Infrastructure Fund - Series O (SLC402)
Starlight Global Infrastructure Fund - Series O6 (SLC452)
Starlight Global Infrastructure Fund - Series I (SLC902)
Distribution Frequency
Fixed Monthly
Important Disclaimer.
The views in this update are subject to change at any time based upon market or other conditions and are current as of January 5, 2024. While all material is deemed to be reliable, accuracy and completeness cannot be guaranteed.
Certain statements in this document are forward-looking. Forward-looking statements (“FLS”) are statements that are predictive in nature, depend upon or refer to future events or conditions, or that include words such as “may,” “will,” “should,” “could,” “expect,” “anticipate,” “intend,” “plan,” “believe,” or “estimate,” or other similar expressions. Statements that look forward in time or include anything other than historical information are subject to risks and uncertainties, and actual results, actions or events could differ materially from those set forth in the FLS. FLS are not guarantees of future performance and are by their nature based on numerous assumptions. Although the FLS contained herein are based upon what Starlight Capital and the portfolio manager believe to be reasonable assumptions, neither Starlight Capital nor the portfolio manager can assure that actual results will be consistent with these FLS. The reader is cautioned to consider the FLS carefully and not to place undue reliance on FLS. Unless required by applicable law, it is not undertaken, and specifically disclaimed that there is any intention or obligation to update or revise FLS, whether as a result of new information, future events or otherwise. Investment funds are not guaranteed, their values change frequently, and past performance may not be repeated.
The content of this document (including facts, views, opinions, recommendations, descriptions of or references to, products or securities) is not to be used or construed as investment advice, as an offer to sell or the solicitation of an offer to buy, or an endorsement, recommendation or sponsorship of any entity or security cited. Although we endeavour to ensure its accuracy and completeness, we assume no responsibility for any reliance upon it. Commissions, trailing commissions, management fees and expenses all may be associated with investment funds. Please read the offering documents before investing. Investors should consult with their advisors prior to investing.
Starlight, Starlight Investments, Starlight Capital and all other related Starlight logos are trademarks of Starlight Group Property Holdings Inc.