Rising Interest Rates and Impact on REITs
Over the last 30 years, REITs have become the global standard for owning publicly-traded, investment grade real estate. Over 35 countries, including every G7 nation, have introduced REIT-like legislation to encourage investment in real estate. Investors in REITs have been rewarded with strong risk-adjusted returns on both an absolute and relative basis.
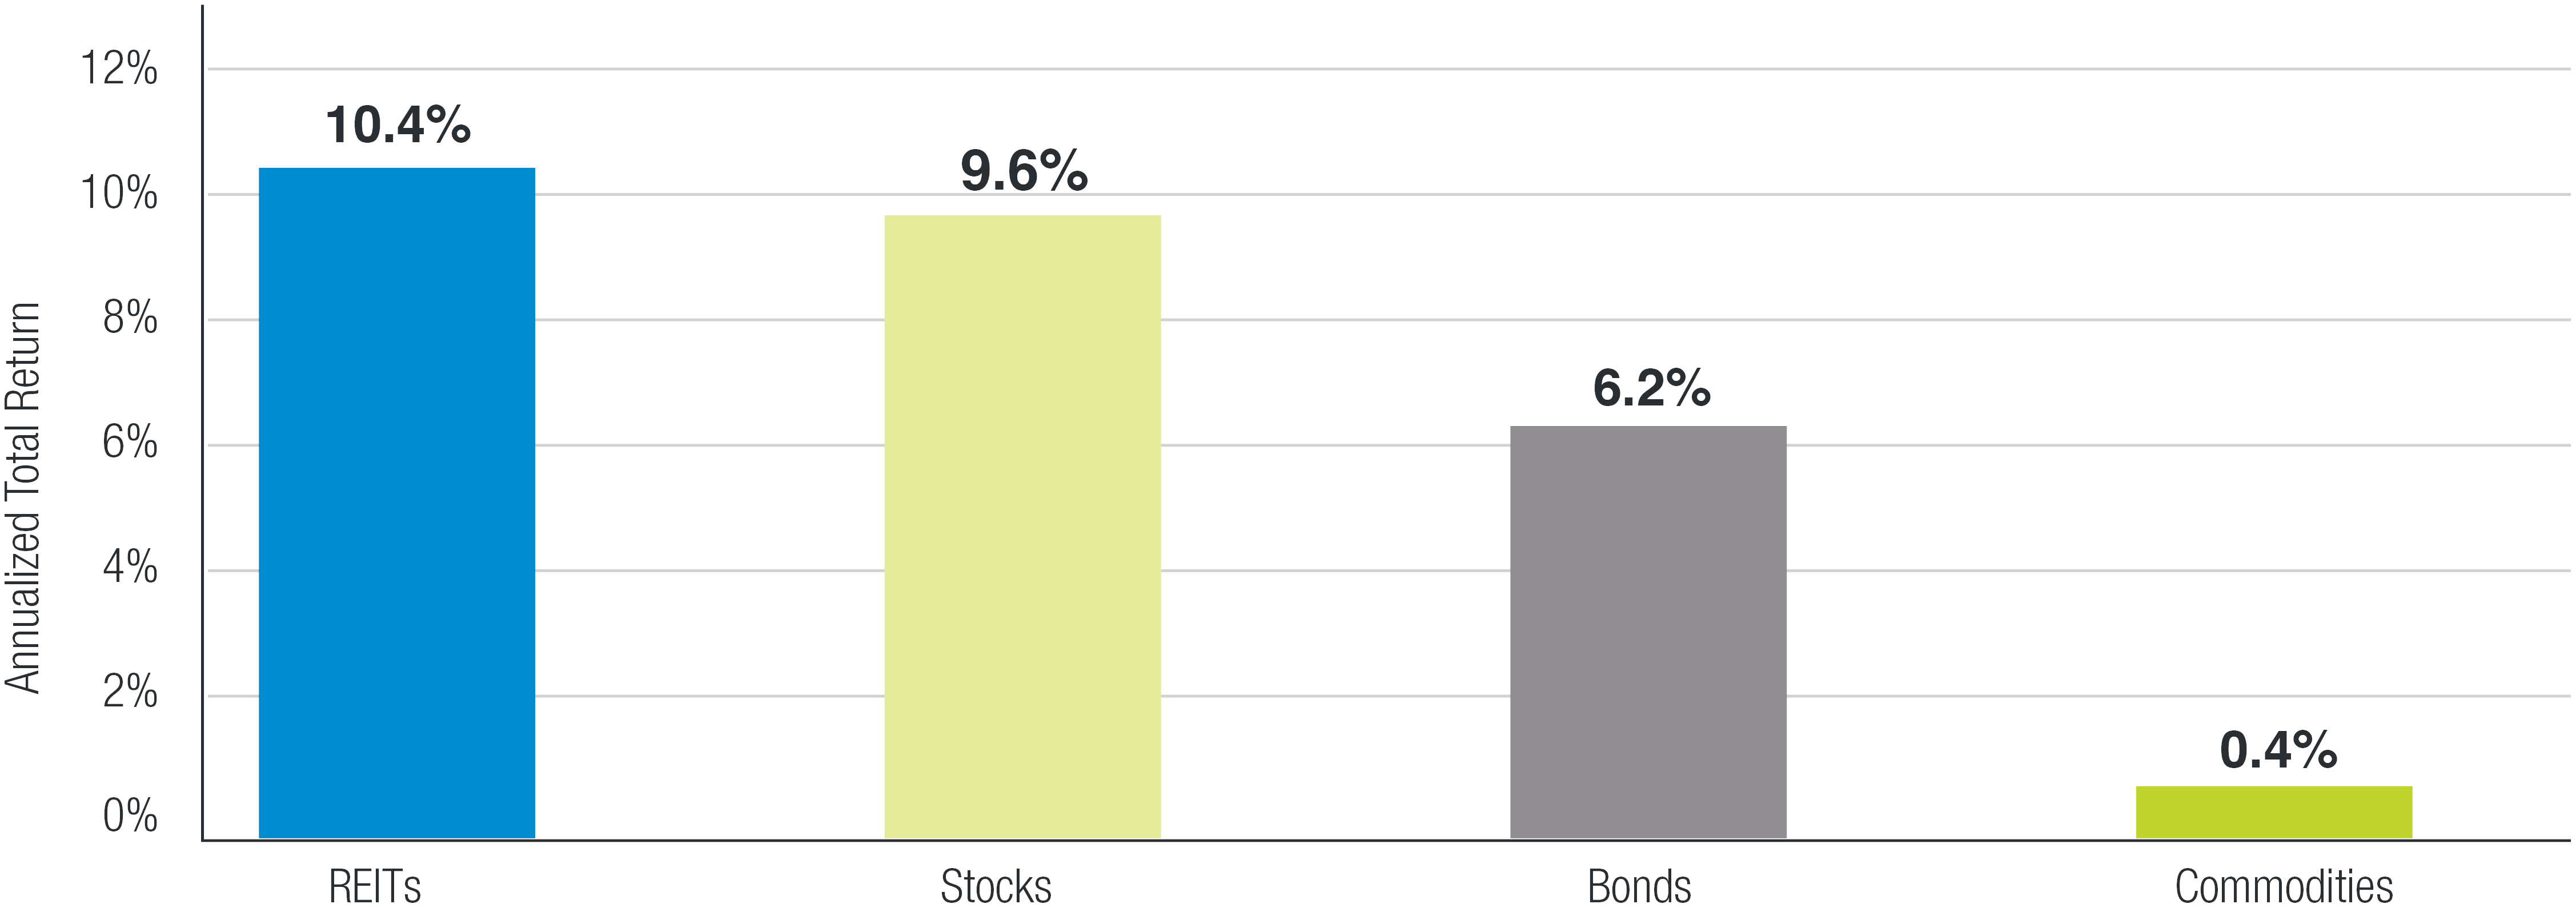
REITs Outperform Other Major Asset Classes

However, recently investors have expressed concerns that REITs may underperform significantly as the Federal Reserve Bank continues to raise the Federal Funds Rate. The thinking is that REITs are highly-levered, bond proxies with very little growth. Therefore, if rates begin to rise then REIT cash flows will decline at a time when discount rates are rising. They fear the end result will be capital losses that offset the higher distribution yield and result in negative total returns.
It’s important for investors to remember that REITs have the ability to stagger and extend their debt maturities, mitigating the impact of rising spot rates. Similarly, a homeowner who just closed on a five year fixed rate mortgage will not see their mortgage payments rise if spot rates rise. REITs with long term, fixed rate debt will not see their cost of capital rise immediately should spot rates rise.
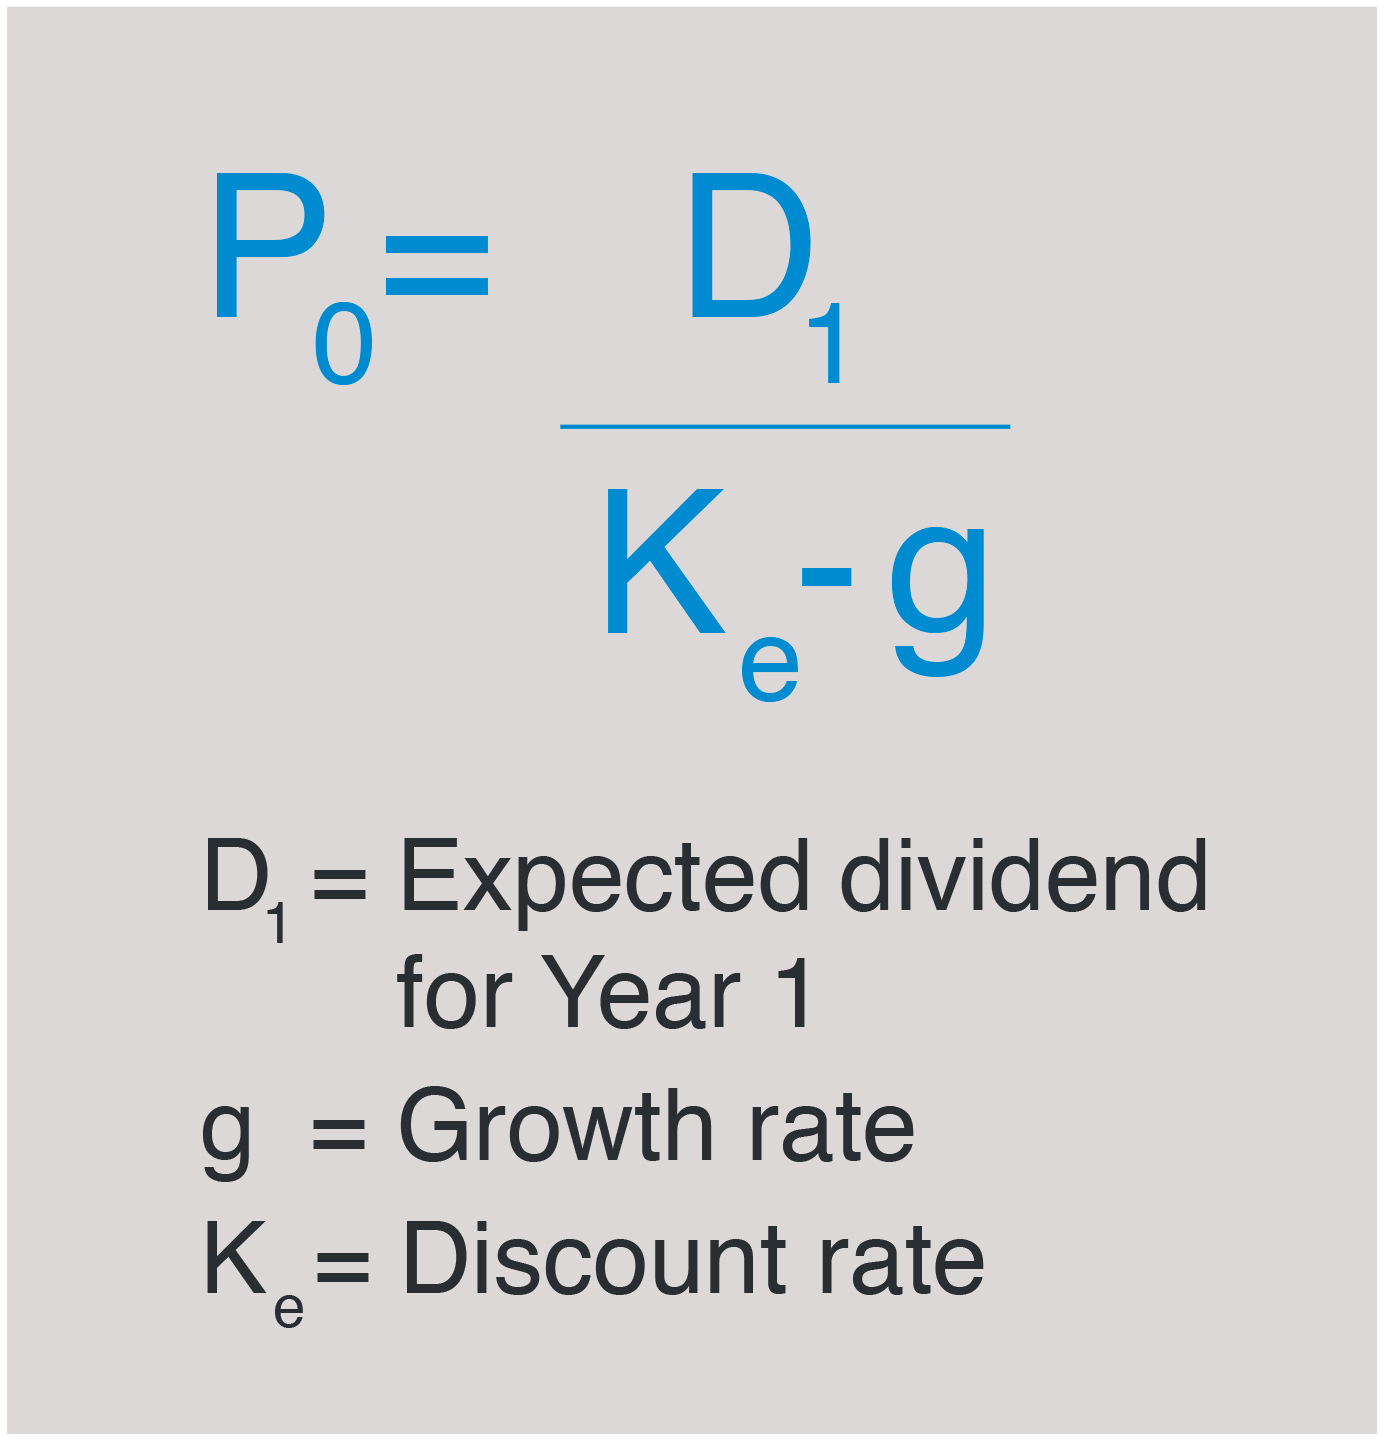
The discount rate argument does have merit, but it applies to all businesses, not just REITs. If spot rates are rising then discount rates should rise and, all else being equal, the value of all businesses should be negatively impacted. The reason the denominator in the dividend discount model is “discount rate minus growth rate” is because the offset to a given discount rate is growth -the higher the better. Bonds and bond proxies have little growth with which to mitigate an increase in the discount rate.
Since 1975 there have been six periods where the U.S. 10 year bond yield has risen significantly. As the chart below demonstrates, in four of those time periods, REITs have generated positive returns and in three of those periods, REITs have outperformed stocks. In only two of those periods did REITs generate negative returns and underperform equities.

REIT Performance During Sustained Periods of Rising Interest Rates
| Time Period | U.S 10 Year Treasury Yield | Cumulative Total Return | |||||
|---|---|---|---|---|---|---|---|
| Beginning Yield % |
Ending Yield % |
in BPS | in % | REITs (%) | Stocks (%) | in % | |
| Dec 1976 - Sep 1981 | 6.9 | 15.3 | 840 | 121.7 | 137.4 | 46.0 | 91.4 |
| Jan 1983 - June 1984 | 10.5 | 13.6 | 310 | 29.5 | 35.6 | 16.5 | 19.1 |
| Aug 1986 - Oct 1987 | 7.2 | 9.5 | 230 | 31.9 | -10.1 | 10.9 | -21.0 |
| Oct 1993 - Nov 1994 | 5.3 | 8.0 | 270 | 50.9 | -10.3 | 0.1 | -10.4 |
| Oct 1998 - Jan 2001 | 4.5 | 6.7 | 220 | 48.9 | 27.4 | 27.8 | -0.4 |
| June 2003 - June 2006 | 3.3 | 5.1 | 180 | 54.5 | 108.2 | 37.6 | 70.6 |
Source: S&P Dow Jones Indices LLC, Bloomberg, The Federal Reserve. REIT total returns are based on the FTSE/NAREIT Equity Index from Dec. 31, 1971, to Dec. 31, 1986, and they are based on the Dow Jones U.S. Select REIT Index after Dec. 31, 1986. Stock total returns are based on the S&P 500. Past performance is no guarantee of future results. Table is provided for illustrative purposes and reflects hypothetical historical performance.
During periods where the 10-year bond yield is rising, many other factors are present that are positive for REIT fundamentals. Rising long bond yields are usually associated with increased economic output and inflation, both of which are likely to be positive for REITs. Increased economic growth should result in the demand for more real estate as employment rises. As occupancies rise, rents should follow as growing firms are able to absorb higher rents. All of this should increase REIT cash flows, distributions and valuations.
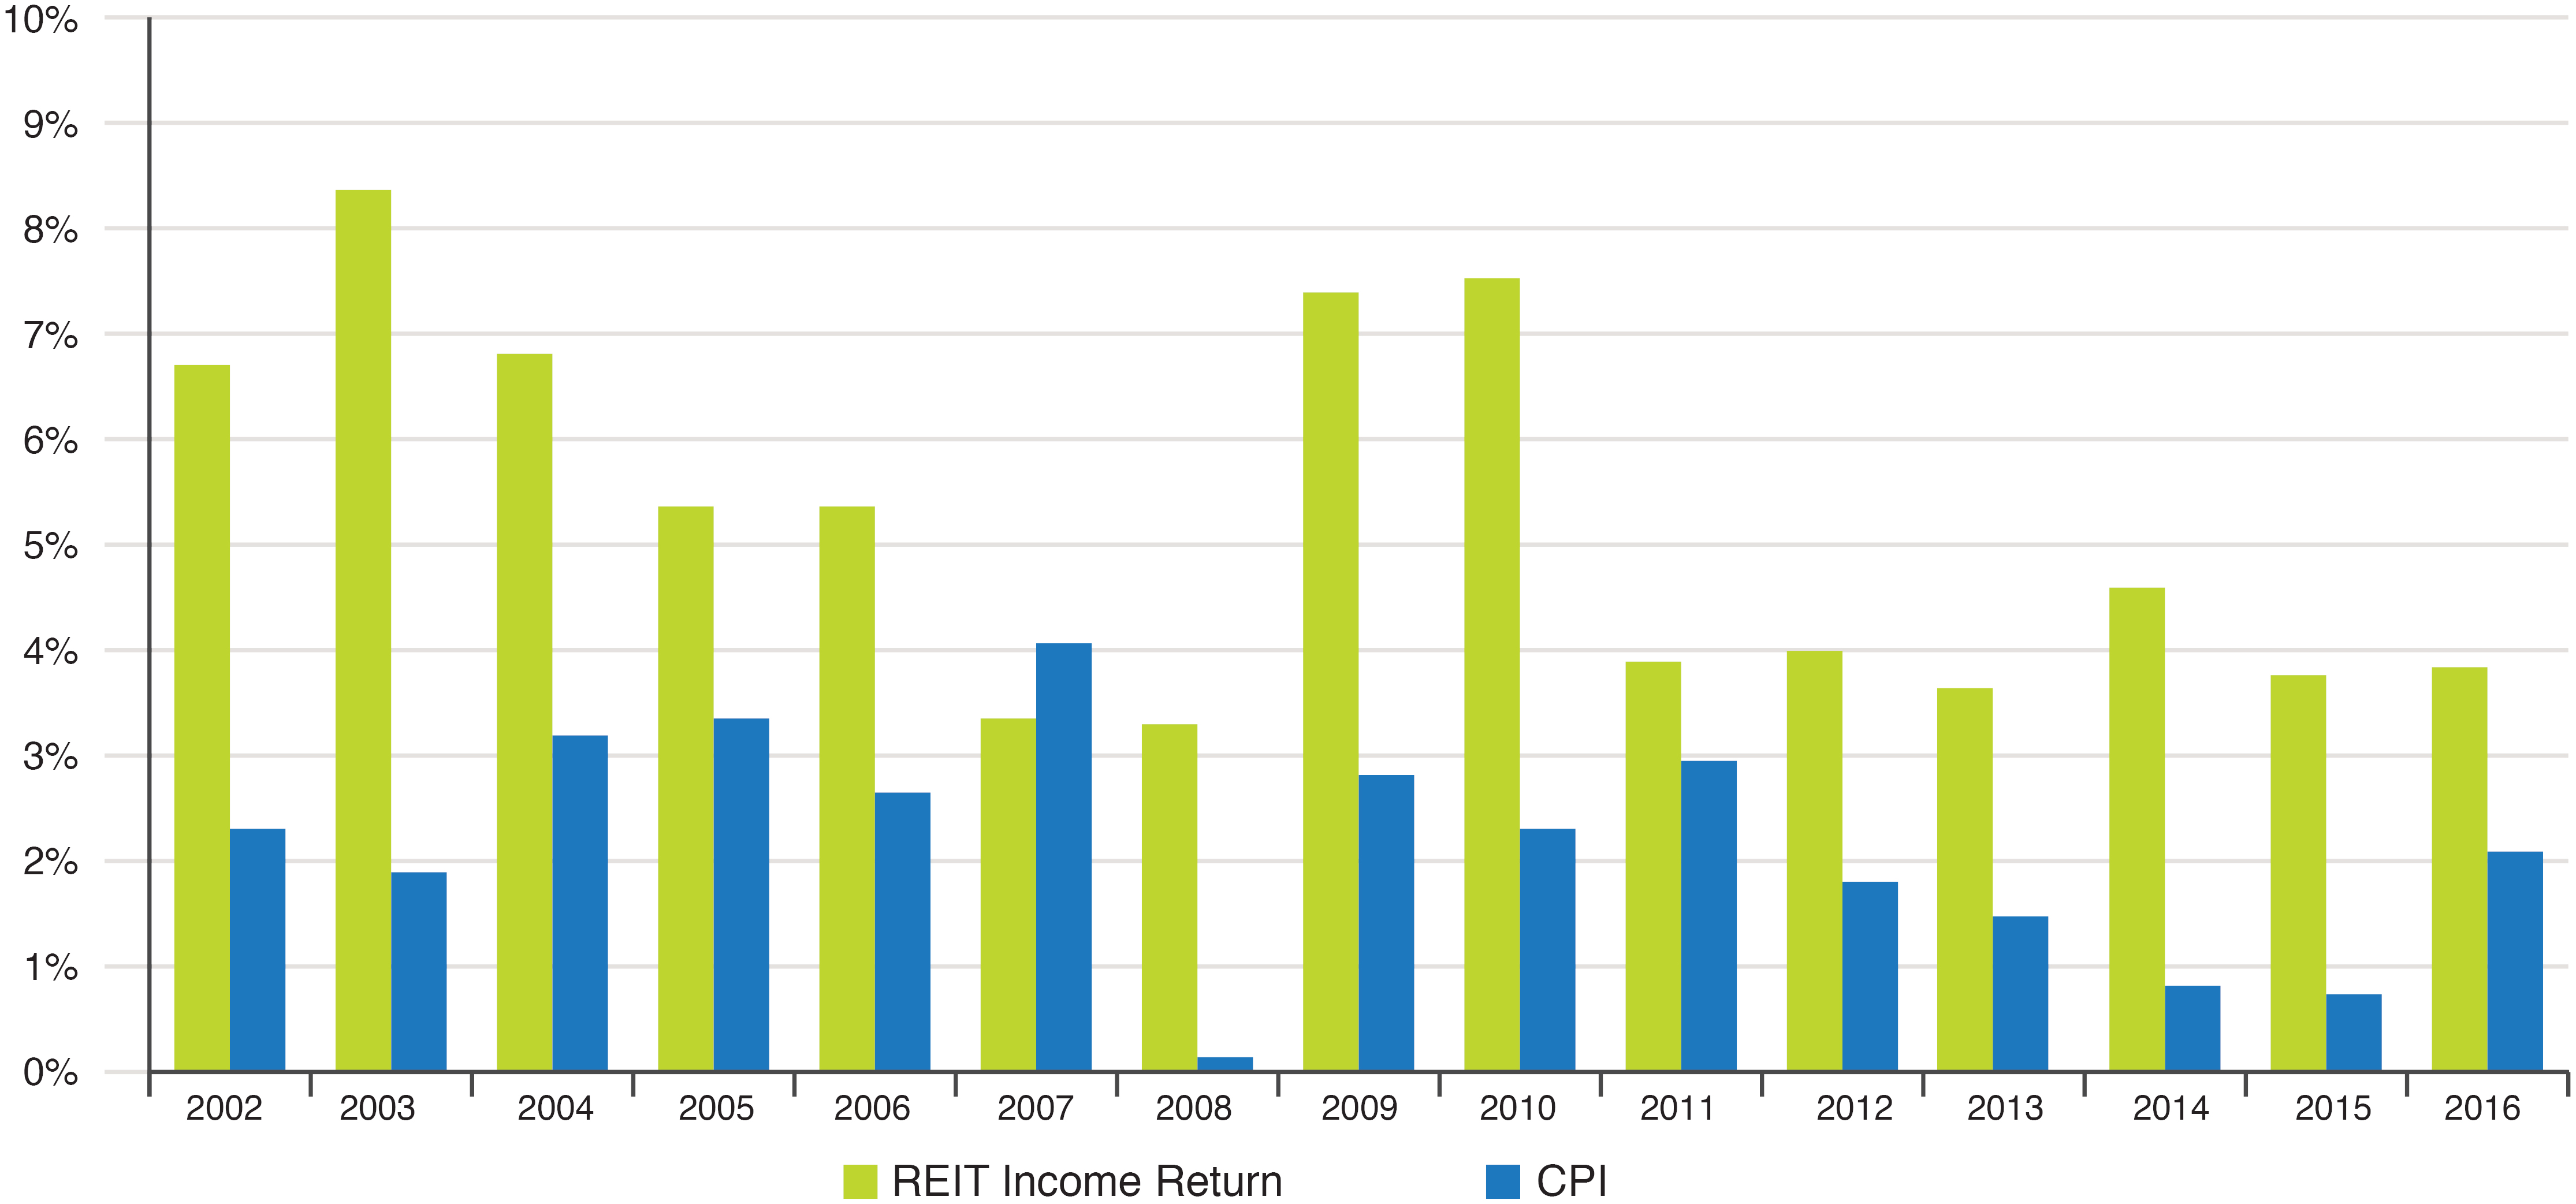
REIT Income has Outpaced Inflation

Asset & Property Management
Collectively, these are the scale and scope advantages that accrue to a skilled operator with a large and clustered portfolio of assets. Skilled property management (operating individual properties) and asset management (optimizing the value of the portfolio of properties) should yield revenue gains and expense savings that allow for cash flow per unit growth, independent of market factors. These benefits tend to accrue to most of the portfolio and perpetuate into the future. For instance, newer, more efficient appliances purchased at a larger discount, unsecured debt issuances in the capital markets and lower property taxes from assessment appeals should all result in higher rents and/or lower expenses. Rolled out across an entire portfolio this should result in meaningful value creation through the business cycle.
Contractual Rent Increases
These represent return on past negotiations and result in current period revenue gains based on past period expenditures (leasing costs and tenant inducements). A quality real estate portfolio should see annual contractual rent increases across most (if not all) of the portfolio leases that don’t expire that year. Indexing these rent increases to inflation creates a natural inflation hedge to offset some of the impact of rising rates and capture some growth.
Positive Lease Renewals & Occupancy Gains
These levers are similar in that capital is required to retain an existing tenant or acquire a new tenant. Positive lease renewals result in increased revenue from the existing asset. Depending on the capital outlay required, this is generally cheaper and preferable to finding a new tenant. Occupancy gains involve securing a new tenant for an existing and unoccupied space. The capital required is generally higher but partially offset by the impact of taking vacant space off the market and tightening up current supply and demand fundamentals.
Accretive Acquisitions & Developments
Both of these activities grow cash flow per unit by adding new assets to the portfolio. Acquisitions are of existing assets and so more operating information is available to make an accurate assessment of the value of the asset. Developments are usually more lucrative from a return standpoint but they also carry greater risks (budget overages, delays, economic downturn). Both of these options entail significant current capital outlays for at risk future cash flows.
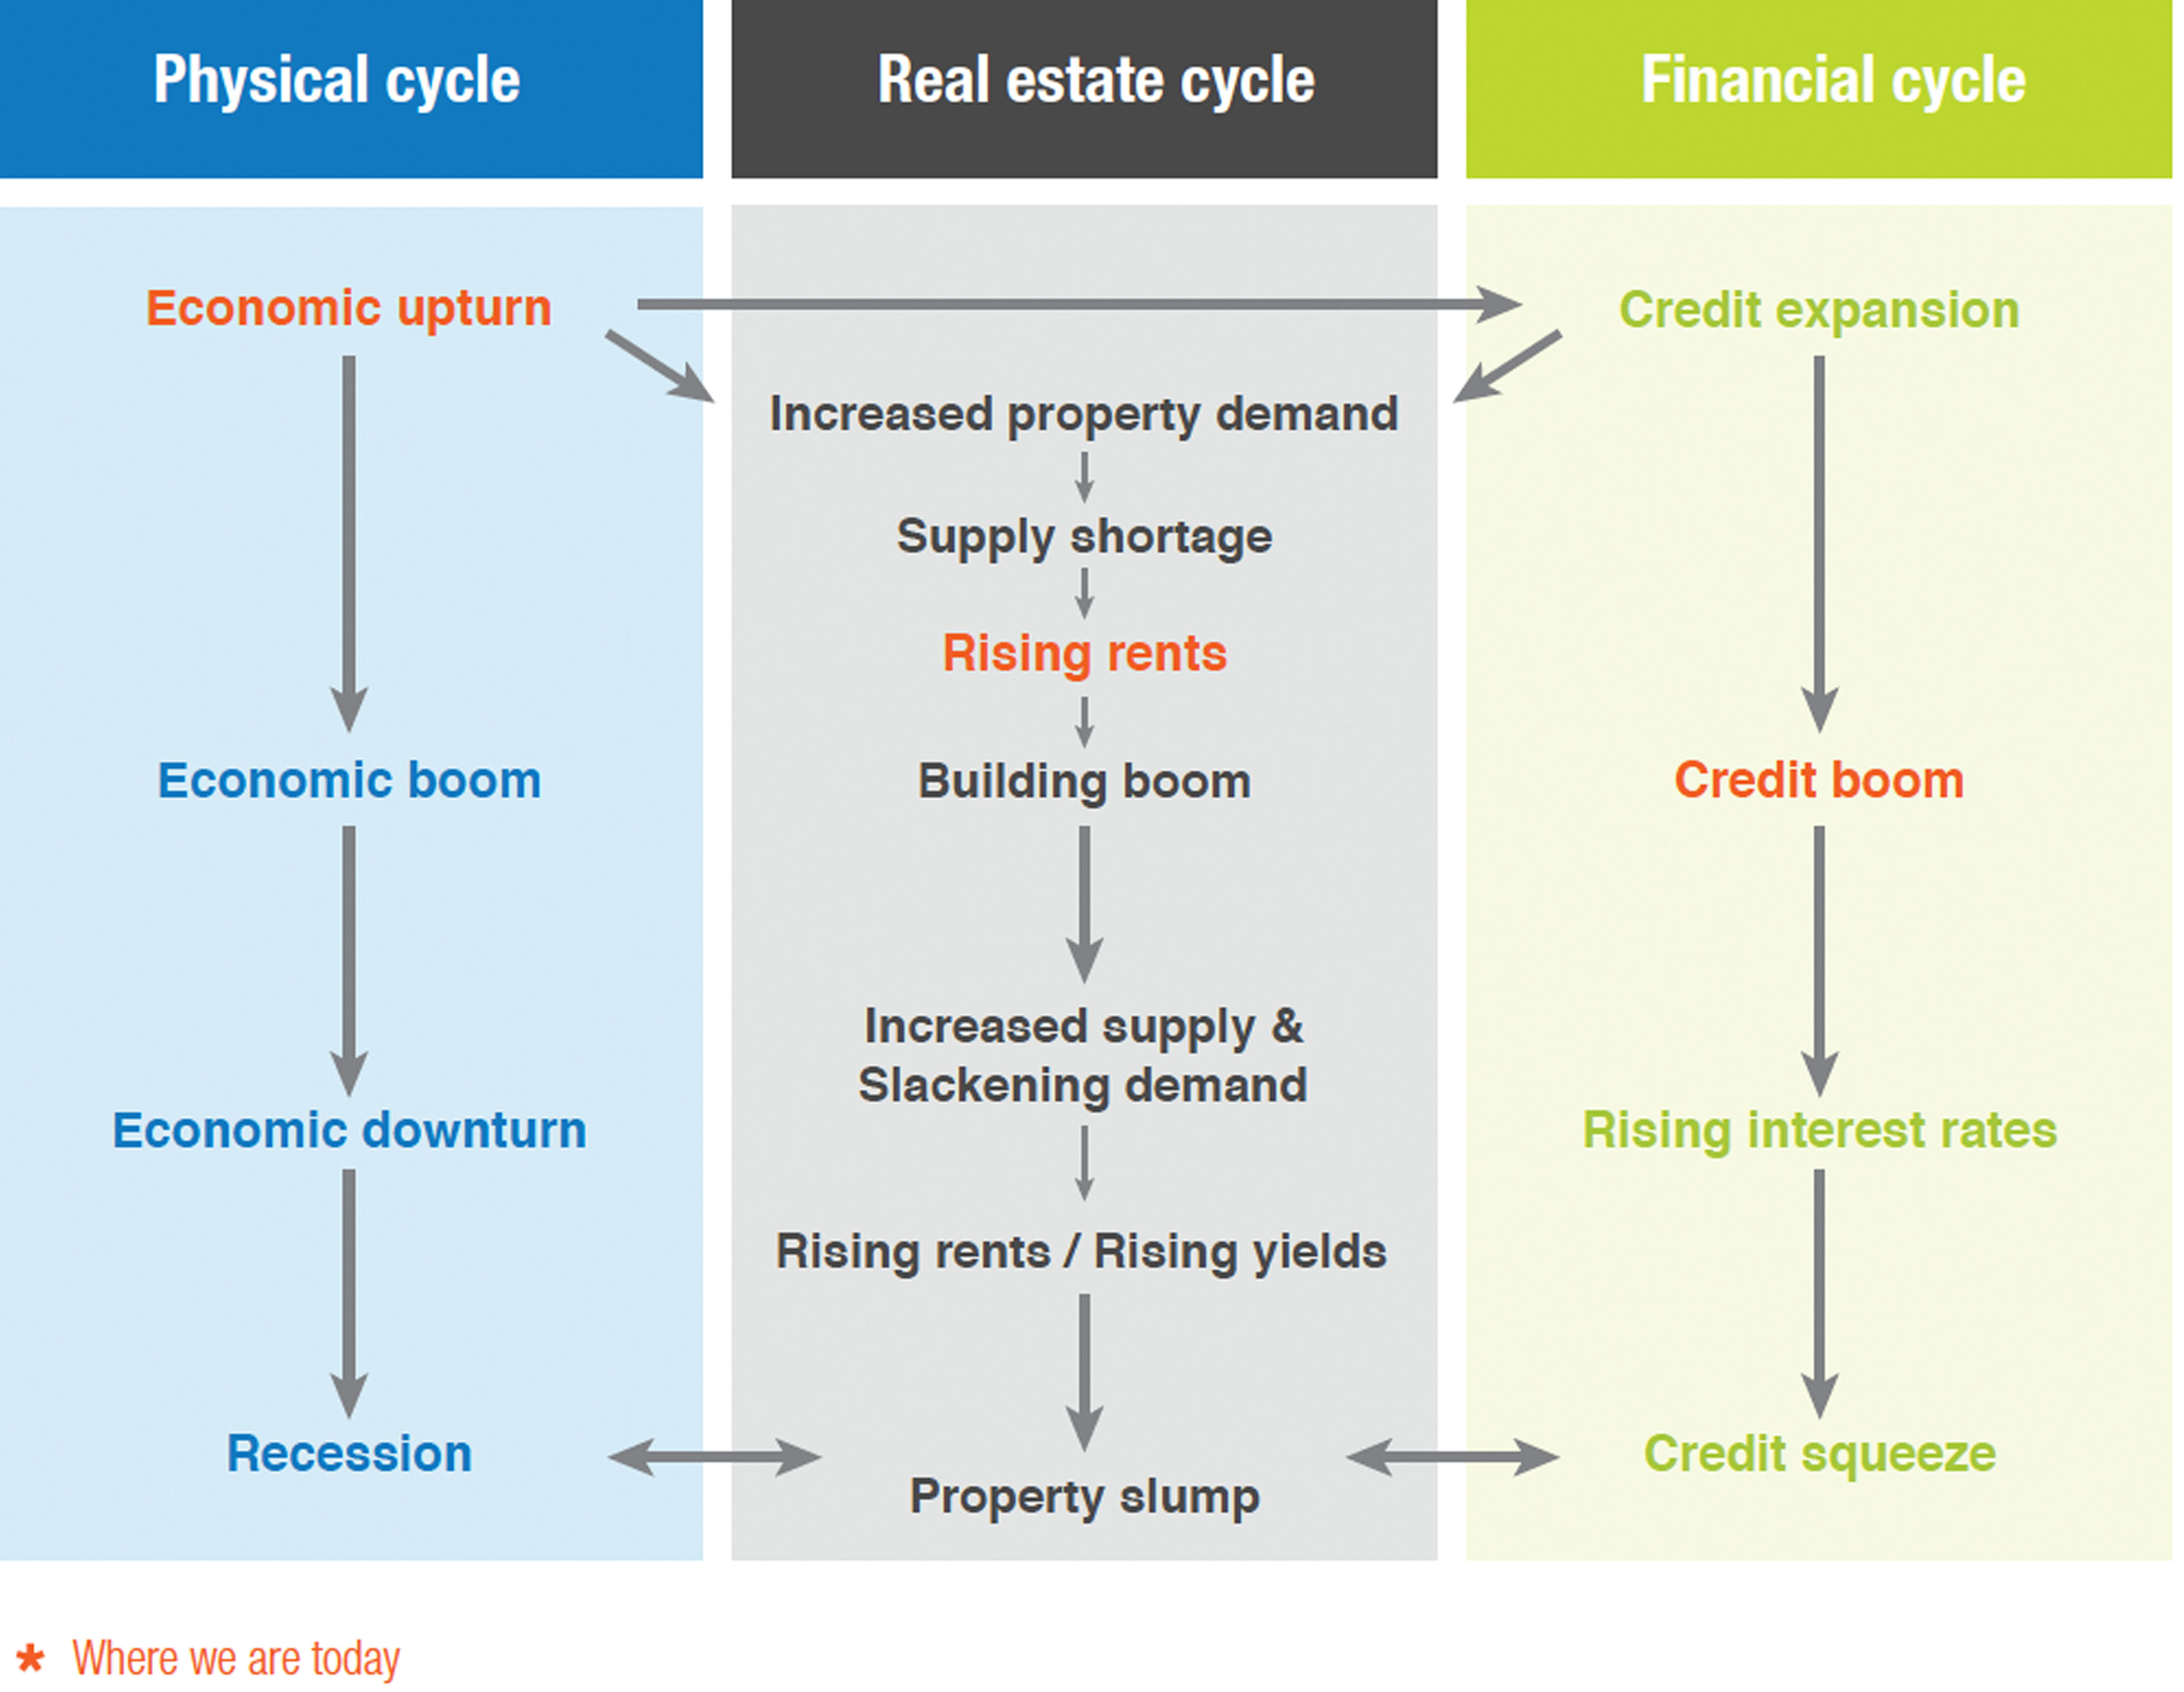
Investors have also questioned the stage of the cycle for REITs and whether a downturn is inevitable. For real estate it is important to gauge both the business and credit cycles to determine where the real estate cycle is headed. Clearly the global economy is in an upswing but we would hesitate to call it an outright economic boom. Similarly, coming on the heels of the Global Financial Crisis (“GFC”), we think credit is expanding but policy rates are still near cyclical troughs. Many global real estate markets were decimated because of rampant over-development leading up to the GFC. The subsequent decline in development (U.S. housing, German residential, Spanish commercial, Irish commercial) has left many markets undersupplied in key real estate sectors. As a result, rents are rising and property cap rates are declining as valuations recover. Accordingly, we see strong potential going forward for real estate returns in the physical and consequently the listed market.
The Real Estate Market is Affected by Changes in Physical and Financial Cycles

Starlight Capital approach
At Starlight Capital, our goal is to add value by concentrating our investments into high quality REITs with several of these value creation levers at their disposal. REITs with more growth potential should outperform through the cycle but their value is especially important when economic activity accelerates, and inflation expectations and spot rates rise. Purchased when they offer us sufficient return for the risk incurred these investments should yield us strong risk-adjusted returns over the long term.
Certain statements in this document are forward-looking. Forward-looking statements (“FLS”) are statements that are predictive in nature, depend upon or refer to future events or conditions, or that include words such as “may,” “will,” “should,” “could,” “expect,” “anticipate,” “intend,” “plan,” “believe,” or “estimate,” or other similar expressions. Statements that look forward in time or include anything other than historical information are subject to risks and uncertainties, and actual results, actions or events could differ materially from those set forth in the FLS. FLS are not guarantees of future performance and are by their nature based on numerous assumptions. Although the FLS contained herein are based upon what Starlight Capital and the portfolio manager believe to be reasonable assumptions, neither Starlight Capital nor the portfolio manager can assure that actual results will be consistent with these FLS. The reader is cautioned to consider the FLS carefully and not to place undue reliance on FLS. Unless required by applicable law, it is not undertaken, and specifically disclaimed that there is any intention or obligation to update or revise FLS, whether as a result of new information, future events or otherwise.
Commissions, trailing commissions, management fees and expenses all may be associated with mutual fund investments. Please read the prospectus before investing. Mutual funds are not guaranteed, their values change frequently and past performance may not be repeated.
Starlight, Starlight Investments, Starlight Capital and all other related Starlight logos are trademarks of Starlight Group Property Holdings Inc.
