View all articles


View all articles
August 12, 2024
Sudden market jolt gives way to tentative calm
MARKETS STARTED WILD AS RECESSION FEARS ROSE, YET BECAME MORE ORDERLY AS LAST WEEK PROGRESSED. WILL THE CALM REMAIN?
A bad monthly survey of US manufacturing businesses combined with a rising unemployment rate to rattle investors early last week. With factories appearing to be shrinking production – and, apparently, cutting jobs – and unemployment rising from 4.1% to 4.3%, investors didn’t stick around.
They sold stocks and corporate bonds, which could be at risk of big drops or wipe-out in recession, and bought government bonds, which typically do well when economies shrink. These moves shifted assumptions about when and how much the US Federal Reserve (Fed) would cut interest rates. In truth, the market moves both informed these assumptions and were influenced by them. It’s hard to untangle how much is cause and how much is effect sometimes. Markets are complicated and self-reinforcing. Often, they create the situations that they predict simply by weight of money.
The classic example is a solvent bank that becomes unviable when depositors and investors decide it should be so and ‘run’. Thankfully, last week there were no systemic worries about bank solvency or the availability of the short-term financing that greases the wheels of capitalism. This is important, because market falls driven by this kind of financial stress have a higher likelihood of falling far further.
The drops in stock markets and bond yields in the first few days of August were breathtaking. The Japanese stock market tumbled more than 15%, the tech-heavy US Nasdaq index fell about 8%, the more diversified US S&P 500 slipped 5%, while UK stocks dropped slightly less. All these markets have recovered considerably since. US government bond yields have finished right back where they started as well, as their prices fell back after a brief jump.
As we’ve already said, markets are complex, so finding reasons for their gyrations is often part story-telling and part transference of your economic hopes and fears on to the evidence. We’ve tried to avoid that and look dispassionately at the data in front of us. It seems that a few bad economic numbers, combined with weakness in some specific company earnings, led some people to worry that an American recession was coming. That led to sharp falls in US stocks, expectations for quicker and greater decreases in interest rates by the central bank, and a fall in the dollar. This would have been exacerbated by sleepy season: many people take holidays in the summer – and traders are people too! With fewer people in the market, prices often become more volatile, which can mean bigger moves on much lower volumes.
This situation was compounded by the Bank of Japan raising its interest rate by 15 basis points to around 0.25%. While not a wholly unexpected move, when combined with a soaring yen and the change in US rate expectations, it appears to have triggered some investors to unwind ‘carry trade’ positions. These are people who borrow in yen (because it’s cheap with an interest rate of less than 0.25%) and invest in other countries, like Mexico and the US (where you can earn 10.75% and 5.5% respectively in overnight bank deposits, or more if you buy riskier assets). With the difference between these rates shrinking, the amount of potential profit was squeezed too, so many investors simply sold – or were perhaps forced to sell by their lenders because of increased volatility. Because another turn of the screw was that the debts of these traders were in yen, which jumped around 7% in a matter of days, while their assets were held in currencies that were weakening. Selling pushes prices lower, encouraging more selling, which cycles around and around.
This all seems to have burnt itself out for now. UBS, an investment bank, estimates the Japanese ‘carry trade’ amounted to roughly $500 billion at the end of July. It believes $200bn was unwound in the chaos of the past week. While a sizeable amount remains, we think the trade will endure, given Japanese rates will probably remain well below those of other nations for many years. This is not a new trade: people have been using Japan’s bargain-basement rates to borrow for investments elsewhere for decades.
So while it appears the original market dips were caused by increased concern about a US recession (what we would call a ‘fundamental’ issue), the main bust-up was caused by investors getting caught off-balance by a trade that moved viciously against them (a ‘technical’ issue). This is a sound reminder of the risks that can pop up unexpectedly and cause mayhem. However, it also shows that it’s important to separate the two types of issue: long-term fundamental ones and short-term technical ones.
Reviewing recession risk
With this in mind, we spent last week taking a deep look at the chances for a US recession. Markets bounce around – sometimes to an extreme degree – for all sorts of reasons. But falls tend to be short-lived unless they are driven, or followed, by a recession. Downturns deliver the most damaging and lingering periods for stocks, so we believe it’s important to focus on the probability of recession.
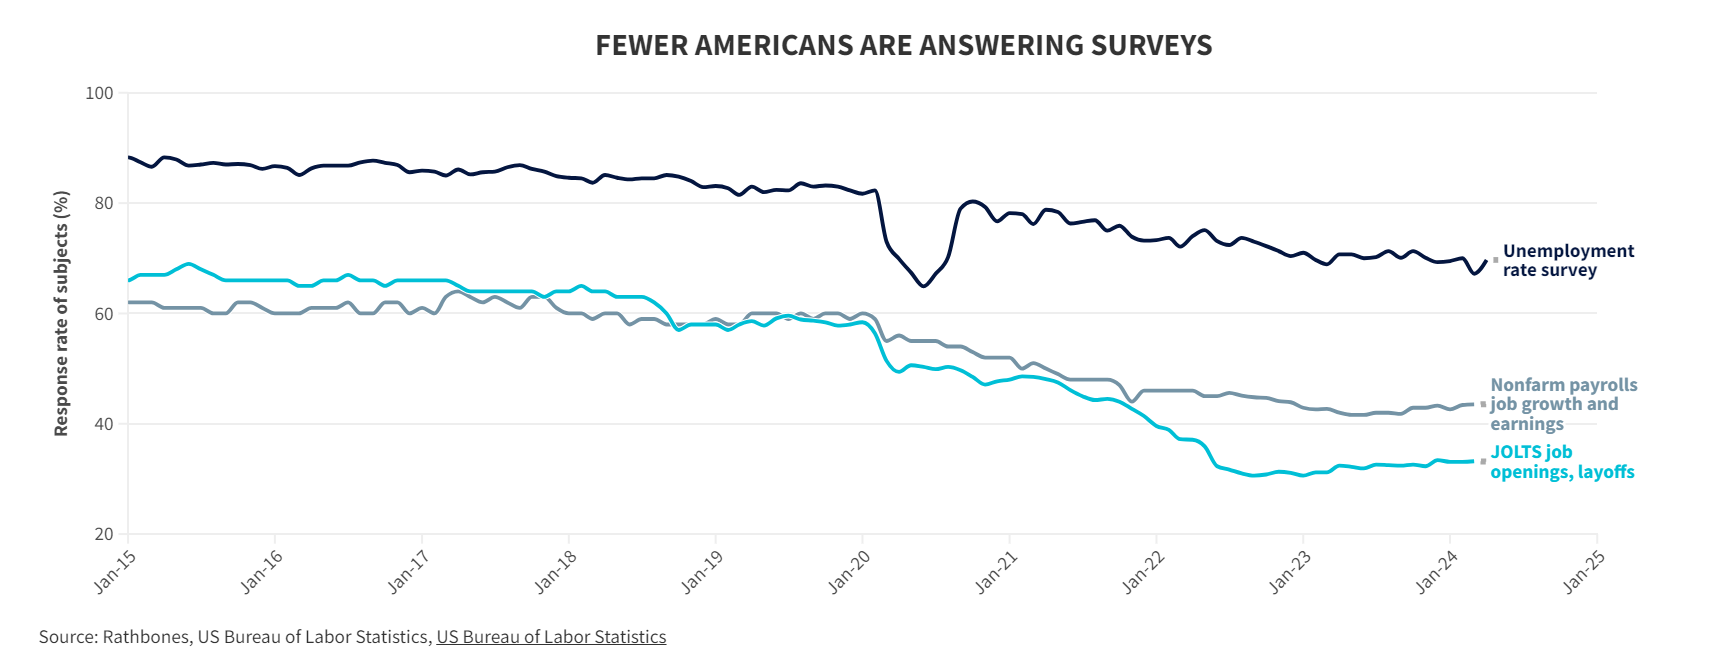
First up, we want to highlight that the US data spooking everyone is not of particularly fantastic quality. Relying on one or two months of numbers and only a couple of different measures to extrapolate the future can be dangerous. Take the labour surveys that report the unemployment rate, jobs growth and earnings: response rates have plummeted in recent years (see chart). This affects the accuracy of the data that comes out the other side. Not only that, but the world is subtly different following the pandemic. We’re living, working and playing differently. That can create what economists call ‘regime change’ – where old statistical relationships are weakened or change entirely. That means old bellwethers for markets may no longer be fit for purpose. In the 1700s, demand for horses was probably a pretty sound indicator of a growing economy. In the 20th century, it was oil. Today, arguably, it could be oil, electricity, or the average screen time we all spend on our smartphones.
Because of these statistical shortcomings, we felt it best to look at a range of measures – as many as we could – that have long track records of pre-empting recessions. We then compared their latest prints with those of the past to see which are flashing warning signs. The only red-light warnings we found were in the differences between short-term and long-term bond yields in the US. The rest showed roughly 20% probability of a US recession, broadly in line with our view from before the chaos.
In short, we found the data doesn’t suggest that there’s been an imminent broad deterioration in the US economy of the kind which would signal a major weakening in the equity market. That doesn’t mean that there won’t be further white-knuckle bouts of volatility over the horizon, however.
The US CPI inflation report for July will be released on Wednesday. Investors expect the headline number to fall back below 3.0% for the first time since March 2021. Core CPI, which removes volatile energy and food prices, will be closely watched as well. It’s forecast to drop from 3.3% to 3.2%. US retail sales are also released this week, so investors will be gauging households’ strength. Any further disappointment here could refire old concerns and roil markets once more. The next Fed interest rate meeting isn’t till 17 and 18 September.
The views in this update are subject to change at any time based upon market or other conditions and are current as of the date posted. While all material is deemed to be reliable, accuracy and completeness cannot be guaranteed.
This document was originally published by Rathbone Investment Management Limited. Any views and opinions are those of the author, and coverage of any assets in no way reflects an investment recommendation. The value of investments and the income from them may go down as well as up and you may not get back your original investment. Fluctuations in exchange rates may increase or decrease the return on investments denominated in a foreign currency. Commissions, trailing commissions, management fees and expenses all may be associated with mutual fund investments. Please read the prospectus before investing. Mutual funds are not guaranteed, their values change frequently, and past performance may not be repeated.
Certain statements in this document are forward-looking. Forward-looking statements (“FLS”) are statements that are predictive in nature, depend upon or refer to future events or conditions, or that include words such as “may,” “will,” “should,” “could,” “expect,” “anticipate,” “intend,” “plan,” “believe,” or “estimate,” or other similar expressions. Statements that look forward in time or include anything other than historical information are subject to risks and uncertainties, and actual results, actions or events could differ materially from those set forth in the FLS. FLS are not guarantees of future performance and are by their nature based on numerous assumptions. The reader is cautioned to consider the FLS carefully and not to place undue reliance on FLS. Unless required by applicable law, it is not undertaken, and specifically disclaimed that there is any intention or obligation to update or revise FLS, whether as a result of new information, future events or otherwise.