The $106 Trillion Dollar Global Infrastructure Opportunity
We are living through the most consequential infrastructure investment cycle in modern history. Across seven foundational verticals — transportation, energy, digital infrastructure, waste and water, agriculture, social infrastructure, and defense — cumulative global investment of $106 trillion will be required by 2040 to meet the demands of a rapidly urbanizing, digitizing, and decarbonizing world.
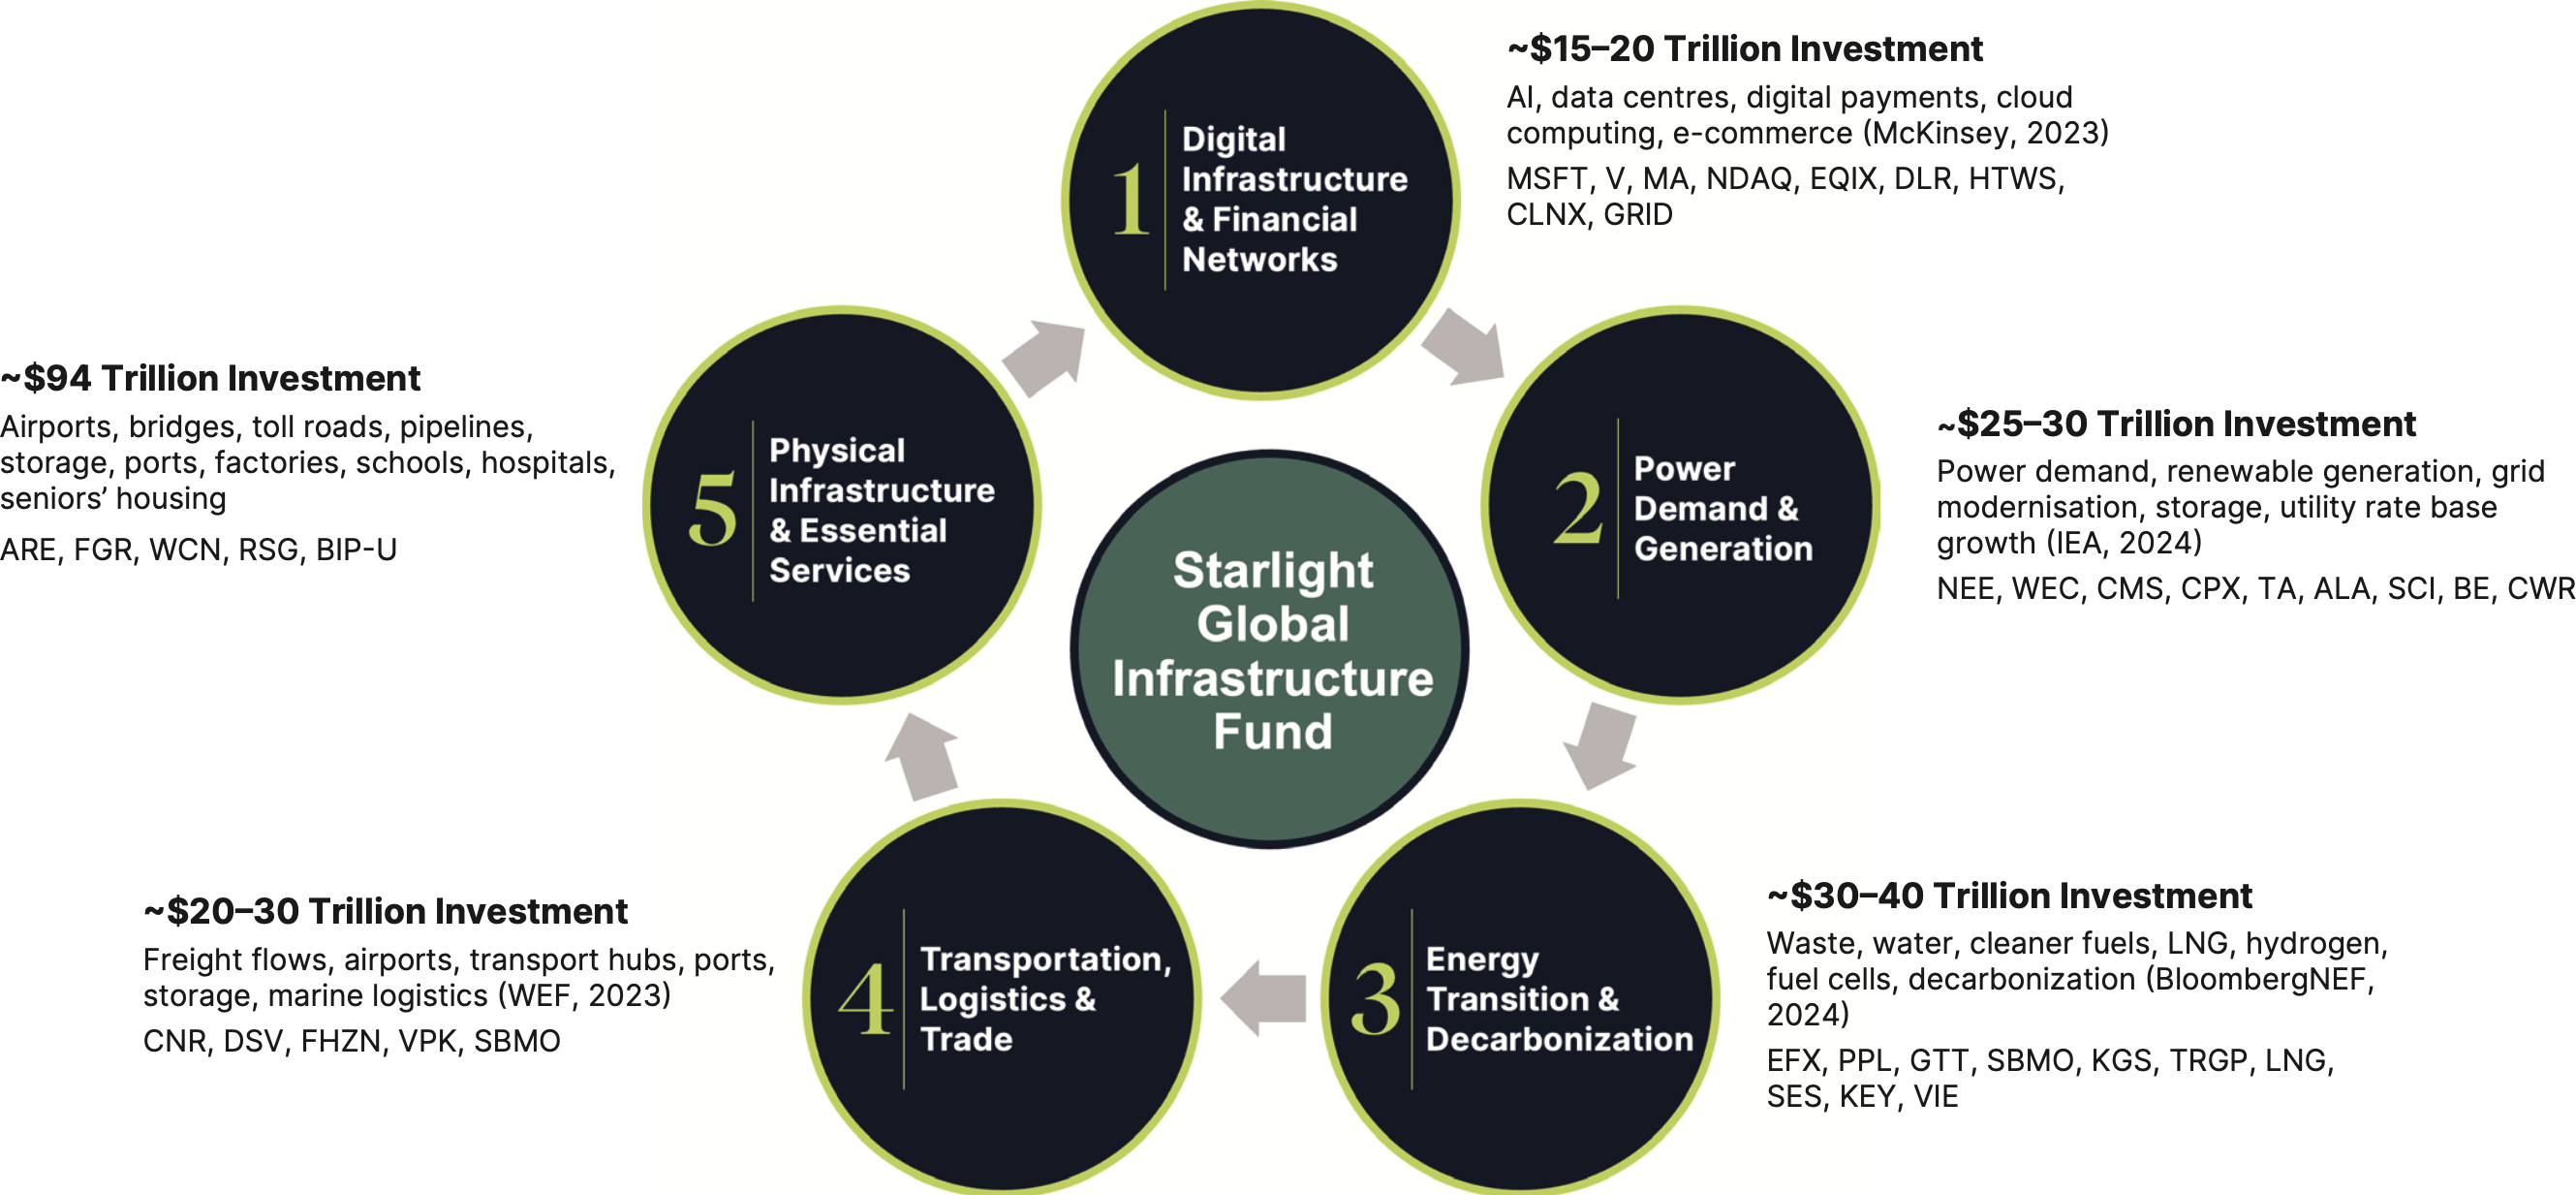
The Starlight Global Infrastructure Fund (the “Fund”) is built to capture this generational opportunity. Rather than investing broadly across all infrastructure verticals, the fund concentrates its 40-holding portfolio across five high-conviction structural supercycles where the combination of long-term contractually secured cash flows, essential service characteristics, and multi-decade demand tailwinds creates the most compelling risk-adjusted return environment for Canadian accredited investors.
The Starlight Global Infrastructure Fund (the “Fund”) is built to capture this generational opportunity. Rather than investing broadly across all infrastructure verticals, the fund concentrates its 40-holding portfolio across five high-conviction structural supercycles where the combination of long-term contractually secured cash flows, essential service characteristics, and multi-decade demand tailwinds creates the most compelling risk-adjusted return environment for Canadian accredited investors.
Additional Information
4.48%
Series F annual distribution
yield paid monthly*
yield paid monthly*
34
Distribution increases in 2025 with an average increase of
13.6%
86.8%
Percentage of 2025 Series F
distributions treated as ROC
distributions treated as ROC
“The global infrastructure gap will require annual investment to increase from the current level of 3% of global GDP to 3.5% — and meeting the UN SDGs requires this to increase further to 3.7%.”
— Global Infrastructure Hub / Oxford Economics, Global Infrastructure Outlook, 2024
The five supercycles represented in the Starlight Global Infrastructure Fund map directly to the most capital-intensive infrastructure verticals globally: Digital Infrastructure & Financial Networks digital and financial network overlay, Power Generation & Demand energy/power, Energy Transition & Decarbonization energy transition subset, Transportation Logistics & Trade, and Physical Infrastructure & Construction waste/water and physical infrastructure. Together, these verticals account for the overwhelming majority of the $106 trillion identified investment requirement.
Global Infrastructure Supercycles
Global investment required over the next 10–25 years (US$)
Global investment required over the next 10–25 years (US$)
Why Infrastructure — And Why Now
Three forces are converging to make the current decade the most significant infrastructure investment window since the post-war reconstruction era.
1. Artificial Intelligence and the Digital Technology Revolution
AI is spurring massive demand for data centres and supporting infrastructure. In 2025, Amazon, Google, Meta, and Microsoft committed more than $400 billion in capital spending — much of it in data centre capacity to support AI. The International Energy Agency (IEA) projects that global electricity consumption from data centres will more than double to over 1,000 TWh annually by 2030, while the Electric Power Research Institute’s (EPRI’s) 2026 Powering Intelligence report projects US data centres will account for 9–17% of total domestic electricity consumption by that date.
“Global demand for data center capacity could more than triple by 2030, forcing substantial upgrades to power, cooling, and network infrastructure.”
— Goldman Sachs Global Investment Research, AI Infrastructure:
The Next Capital Expenditure Supercycle, 2024
2. The Global Energy Transition
The clean energy transition is among the most substantial forces shaping infrastructure investment globally. Global installed wind and solar capacity rose approximately 20% annually from 2010 to 2023, according to the IEA. BloombergNEF’s 2026 Energy Transition Investment Trends report confirmed that global clean energy investment reached a record $2.3 trillion in 2025 — up 8% year-over-year — with clean energy supply investment surpassing fossil fuel supply for the second consecutive year. To meet global decarbonization targets, the IEA estimates annual energy infrastructure investment must more than double by 2030.
3. Geopolitical Realignment and Supply Chain Restructuring
Infrastructure investment has become a strategic tool in global politics. Countries are using large-scale projects to extend influence, secure resources, and reshape trade networks. Nearshoring and friendshoring trends are restructuring global trade infrastructure — a direct tailwind for the Fund’s transportation and logistics holdings. The Organisation for Economic Co-Operation and Development (OECD) and World Bank have documented that Southeast Asian governments alone have announced investments of more than $250 billion in ports, deep-water berths, rail, and logistics parks in direct response to supply chain diversification away from China.
$36T
Transportation & logistics investment need (GI Hub, 2024)
$23T
Energy & power investment need
(IEA / GI Hub, 2024)
(IEA / GI Hub, 2024)
$19T
Digital infrastructure investment need (GI Hub, 2024)
These forces are amplified by a decisive shift in how private capital is deployed. From the second half of 2023 through the first half of 2024, cross-vertical infrastructure strategies — those investing at the intersection of multiple infrastructure themes — attracted 75% of all infrastructure capital raised globally, according to the IJInvestor Funds and Investors Report. The Fund’s five-supercycle structure is designed precisely to capture this cross-vertical opportunity set.
1
Digital Infrastructure & Financial Networks
Tower operators · Data centres · Payment networks · Hyperscaler connectivity
The Investment Thesis
Digital infrastructure requires an estimated $19 trillion in global investment by 2040 — and while this figure may appear lower than transportation or energy in absolute dollar terms, its role as the enabling layer for every other vertical means it will see the fastest growth from current investment levels. Fibre networks, towers, satellites, and data centres form the backbone of business, cities, digital services, and AI-powered systems across all other infrastructure categories.
As of mid-2024, 78% of organizations globally reported using AI in at least one business function, up from 55% the prior year, according to a McKinsey State of AI survey. Gen AI adoption more than doubled from 33% to 71% in just over a year. A decade ago, 30-megawatt data centres were considered large; today, 200-megawatt facilities are increasingly common. Goldman Sachs projects data centre power demand will increase by 165% by 2030.
The payment network layer that sits atop this digital infrastructure is equally infrastructure-like in its characteristics. The Capgemini World Payments Report 2025 documents that global non-cash transaction volumes reached 1.4 billion in 2023 and are on track to reach 2.83 billion by 2028 — growth that flows directly through the payment rails of the Fund’s network holdings. These platforms exhibit defining infrastructure characteristics: multi-year issuing bank agreements, zero credit risk, and switching costs that take years and significant capital to overcome.
Selected Fund Holdings
Mastercard
United States
Yield: 0.67%
Dividend CAGR: +14% (5Y)
Mastercard’s global payment network processes $9T+ in annual switched volume across 210+ countries. Q4 2025 revenue grew 17.5% YoY; adjusted EPS beat consensus by ~13%. With zero credit risk and a 14% 5-year dividend CAGR, Mastercard exhibits defining infrastructure quality. Capgemini projects global non-cash volumes reaching 2.83 billion annually by 2028, underpinning long-run volume growth.
Tantalus Systems
Canada
Yield: Nil
Dividend CAGR: N/A
Tantalus delivers purpose-built smart grid platforms — connected devices, IoT communications networks, and AI-enabled analytics — to public power utilities across North America. FY2025 revenue grew 22% YoY to C$54M; book-to-bill ratio of 1.2 signals strong backlog visibility. With 38+ data centre connection applications representing 20 GW of new Alberta grid load, EPRI’s grid modernisation mandate creates structural multi-year demand for Tantalus’ TRUConnect and TRUGrid platforms.
Helios Towers
United Kingdom
Yield: Nil
Dividend CAGR: N/A
Europe’s largest independent tower operator, Helios Towers owns and operates 14,000+ tower sites across Africa and the Middle East under inflation-linked, long-term tenancy agreements averaging 8+ years. The GSMA Mobile Economy 2025 report projects African mobile penetration rising to 80%+ by 2030, driving new co-location demand on each Helios site. FY2025 results delivered 8% revenue and 12% EBITDA growth.
Equinix
United States
Yield: 2.14%
Dividend CAGR: +12% (5Y)
Equinix’s 260+ IBX data centres interconnect hyperscalers, enterprises, and carriers globally. FY2025 revenue grew 6% YoY to $9.3B on AI-driven demand. Annual revenue retention rates exceed 95% across multi-year colocation and interconnection agreements with Microsoft, Amazon, Google, and Meta.
Sources: IEA, Electricity 2024; Goldman Sachs GIR, AI Infrastructure Supercycle, 2024; EPRI, Powering Intelligence 2026; Capgemini, World Payments Report 2025; GSMA, Mobile Economy 2025; IJInvestor, Funds and Investors Report H1 2024. CAGR is Compound Annual Growth Rate.
2
Power Generation & Demand
Regulated utilities · Renewable energy · Grid modernisation · Energy storage
The Investment Thesis
Power infrastructure — including generation, transmission, and distribution assets — represents an estimated $23 trillion in required global investment through 2040, driven by a sustained acceleration in electricity demand not seen in developed economies for two decades. The IEA’s Electricity 2024 report projects global energy demand growing approximately 4% annually through 2027, with data centres, EV charging, and industrial electrification as the primary new demand categories.
In the United States alone, EPRI projects that data centre electricity consumption will reach 380–790 TWh by 2030 — up from approximately 177–192 TWh today — requiring the equivalent of between 50 and 200 new large-scale power plants. Grid modernisation is now a bipartisan imperative: the US Infrastructure Investment and Jobs Act allocated $65 billion to grid upgrades, while the EU’s REPowerEU programme has mandated accelerated grid investment through 2030, creating a multi-year contracted order book for transmission and distribution equipment manufacturers and regulated utilities.
“In just the next two years, data centre power demand globally is expected to increase by 50 percent, forcing new investment in generation, transmission, and grid resilience infrastructure.”
— Goldman Sachs Global Investment Research, Powering AI: Electricity Demand and Infrastructure
BloombergNEF documents that grid investment reached $483 billion globally in 2025 — up 17% year-over-year — making it one of the fastest-growing categories in clean energy capital deployment. The convergence of AI-driven electricity demand growth, decarbonization mandates, and aging grid infrastructure creates a structural multi-decade investment cycle for regulated utilities and renewable energy platforms that hold long-duration, inflation-linked contracted assets.
Selected Fund Holdings
Selected Fund Holdings
NextEra Energy
United States
Yield: 2.70%
Dividend CAGR: +10% (5Y)
NextEra is the world’s largest wind and solar generator with a 30 GW contracted backlog. Q4 2025 adjusted EPS grew 8.2% YoY, exceeding guidance; FPL secured a new 4-year rate agreement at 10.95% allowed ROE. Quarterly dividend raised 10%; NextEra is in active discussions to provide dedicated power for 20 AI data centre hubs.
WEC Energy Group
United States
Yield: 3.30%
Dividend CAGR: +7% (3Y)
WEC’s regulated utilities serve Wisconsin, Illinois, Michigan, and Minnesota under rate-approved returns. EPRI’s Powering Intelligence 2026 identifies the US Midwest as facing sharp data centre-driven load growth, directly expanding WEC’s $24B capital investment case through 2028. Twenty-three consecutive years of dividend increases.
AltaGas
Canada
Yield: 3.70%
Dividend CAGR: +5% (3Y)
AltaGas serves 1.7M+ regulated utility customers in Canada and the US, earning inflation-adjusted allowed returns. Its Ridley Island Propane Export Terminal shipped record volumes in 2025. The IEA identifies natural gas distribution and LNG infrastructure as critical transitional energy assets through 2035; AltaGas’s regulated utility capital plan supports 6–7% rate-base growth annually through 2027.
Bloom Energy
United States
Yield: Nil
Dividend CAGR: N/A
Bloom’s solid oxide fuel cells provide always-on, behind-the-meter power under multi-year PPAs with investment-grade counterparties. EPRI’s Powering Intelligence 2026 identifies on-site generation as a key hyperscaler risk-mitigation strategy. Revenue grew 25% in 2025.
Sources: IEA, World Energy Outlook 2024; IEA, Electricity 2024; EPRI, Powering Intelligence 2026; BloombergNEF, Energy Transition Investment Trends 2026; Goldman Sachs GIR, Powering AI, 2024; US Bipartisan Infrastructure Law, 2021. CAGR is Compound Annual Growth Rate.
3
Energy Transition & Decarbonization
LNG infrastructure · Renewable fuels · Carbon transition assets · Clean energy
The Investment Thesis
The global energy transition represents one of the most capital-intensive structural shifts in infrastructure history. BloombergNEF’s Energy Transition Investment Trends 2026 report confirmed that global energy transition investment reached a record $2.3 trillion in 2025 — up 8% from 2024 — with clean energy supply investment surpassing fossil fuel supply for the second consecutive year. BloombergNEF’s base-case economic transition scenario projects average annual investment reaching $2.9 trillion over the next five years.
The IEA’s World Energy Outlook 2024 identifies a critical decade for the energy transition: demand for all three fossil fuels is set to peak by 2030 under stated policy scenarios, while electricity demand grows much faster than overall energy demand. This transition is not binary — natural gas infrastructure, LNG terminals, and midstream networks play a pivotal bridging role, particularly across Asia and Europe where coal-to-gas switching is the most practical near-term decarbonization pathway. The IEA projects LNG trade volumes growing through 2030 as European energy security imperatives and Asian demand growth outpace domestic renewable capacity additions.
“Clean energy supply investment outpaced fossil fuel supply for a second consecutive year in 2025, with the gap widening to $102 billion — yet LNG infrastructure demand remains robust as energy security imperatives drive long-term contracted volumes.”
— BloombergNEF, Energy Transition Investment Trends 2026, January 2026
The intersection of energy transition and transportation creates the most rapidly emerging investment theme: sustainable fuels. Global Sustainable Aviation Fuel (SAF) demand is projected to reach 17 million metric tons per year by 2030, according to International Air Transport Association (IATA) — requiring LNG and midstream infrastructure to co-exist alongside emerging clean fuels networks through the transition decade. The IEA’s Gas Market Report 2025 documents that European energy security policy has created structural, decade-long demand for US LNG under long-term fixed-price contracts.
Selected Fund Holdings
Selected Fund Holdings
Cheniere Energy
United States
Yield: 0.87%
Dividend CAGR: +20% (3Y)
As the largest US LNG exporter, Cheniere operates the Sabine Pass and Corpus Christi liquefaction facilities under long-term, fixed-fee contracts with global counterparties — with take-or-pay structures that provide cash flow regardless of spot market pricing. The IEA’s Gas Market Report Q1 2025 documents that European energy security policy has locked in long-term US LNG contracts through the mid-2030s, providing Cheniere with a contracted order book that substantially reduces volume risk. LNG flow disruptions through the Strait of Hormuz validated the strategic value of Western hemisphere LNG supply.
Pembina Pipeline
Canada
Yield: 5.20%
Dividend CAGR: +2% (3Y)
Pembina’s NGL pipeline and midstream network transports hydrocarbons across Western Canada with >90% fee-based revenue. Q3 2025 adjusted EBITDA grew 8% YoY; Pembina raised its monthly dividend for the 14th consecutive year. The Canada Energy Regulator’s 2024 Energy Future report identifies WCSB production growing through 2035, underpinning sustained throughput demand.
Gaztransport &
Technigaz
Technigaz
France
Yield: 1.50%
Dividend CAGR: +35% (3Y)
GTT’s membrane technology is specified in virtually every new LNG carrier built globally, generating royalty-based revenue across each vessel’s 40-year operational life. The International Gas Union’s 2024 World LNG Report documents carrier orderbooks at multi-decade highs. FY2025 order intake exceeded 30 vessels; the 35% 3-year dividend CAGR reflects rapid earnings growth as LNG shipping demand accelerated post-Ukraine.
Secure Waste
Infrastructure
Infrastructure
Canada
Yield: 1.00%
Dividend CAGR: +20% (3Y)
Secure Waste Infrastructure provides essential industrial waste processing, water treatment, and pipeline terminal services across Western Canada under multi-year agreements. Federal and provincial emissions regulations create structural demand for Secure’s permitted facilities — replication requires years of regulatory approvals. FY2025 adjusted EBITDA grew 18% YoY; recurring infrastructure services now exceed 70% of total revenue.
Sources: BloombergNEF, Energy Transition Investment Trends 2026; IEA, World Energy Outlook 2024; IEA, Gas Market Report Q1 2025; International Gas Union, World LNG Report 2024; IATA, Sustainable Aviation Fuels Fact Sheet, June 2025; Canada Energy Regulator, Canada’s Energy Future 2024. CAGR is Compound Annual Growth Rate.
4
Transportation, Logistics & Trade
Rail networks · Freight forwarders · Port infrastructure · Last-mile logistics
The Investment Thesis
Transportation and logistics is the single largest global infrastructure investment vertical, with $36 trillion in required cumulative investment through 2040 according to the Global Infrastructure Hub’s Oxford Economics analysis — reflecting the scale of unmet demand across aging roads, congested ports, and strained public transit systems globally, compounded by decarbonization mandates and the restructuring of global supply chains. Maritime transportation alone facilitates approximately 80% of global trade by volume, according to UNCTAD’s 2024 Review of Maritime Transport.
The OECD and World Bank have documented a decisive supply chain shift: Vietnam and Indonesia attracted almost $50 billion of greenfield manufacturing projects in 2023 alone, raising Southeast Asia’s foreign direct investment in manufacturing by roughly 20% from 2019 levels. In response, Southeast Asian governments have announced investments of more than $250 billion in ports and logistics infrastructure. This supply chain realignment — driven by geopolitical tension and China-plus-one diversification strategies — creates structural, multi-decade demand for global logistics operators with the scale and network density to manage complex, multi-modal freight flows.
“Southeast Asian governments have announced investments of more than $250 billion in ports and deep-water berths, rail, bonded logistics parks, and other transportation infrastructure to facilitate exports — the largest regional logistics investment programme in history.”
— World Bank, Diversifying Global Supply Chains Report, 2024
Automation and AI are simultaneously reshaping transportation economics. In rail, early adopters are using high-capacity fibre backhaul and AI to optimize crew planning, trimming labour costs by 10–15% according to studies cited by the International Union of Railways (UIC). Predictive maintenance programs have boosted fleet reliability by approximately 15% and lowered maintenance costs by roughly 20%. For rail and logistics operators with the technology investment and scale to capture these efficiency gains, the structural competitive advantage compounds over time.
Selected Fund Holdings
Selected Fund Holdings
DSV A/S
Denmark
Yield: 0.71%
Dividend CAGR: +5% (3Y)
Following the $19B DB Schenker acquisition, DSV is one of the world’s top two freight forwarders across 90+ countries. Management has guided €1.5B+ in synergies by 2027; integration is progressing ahead of schedule. UNCTAD documents maritime transport facilitating 80% of global trade — DSV’s multi-modal network benefits directly from the OECD-documented nearshoring shift.
Canadian National
Railway
Railway
Canada
Yield: 2.10%
Dividend CAGR: +7% (5Y)
CN Rail operates the only transcontinental railway in North America connecting three coasts — Atlantic, Pacific, and Gulf of Mexico — under the economic regulation of the Canadian Transportation Agency. Transport Canada and the US Surface Transportation Board have both identified Class I rail as critical national infrastructure, with capital intensity, long asset lives, and regulatory oversight creating high barriers to competition that protect CN’s route monopolies. CN’s intermodal network benefits directly from North American manufacturing reshoring, as documented by the Reshoring Initiative’s 2024 report showing record US manufacturing job announcements, which drives increased domestic freight volumes through CN’s inland terminals.
Brookfield
Infrastructure
Partners
Infrastructure
Partners
Canada
Yield: 5.50%
Dividend CAGR: +6% (5Y)
BIP’s portfolio spans utilities, transport, midstream, and data infrastructure across five continents — the most concentrated single-holding expression of all five fund supercycles. BIP’s 2025 Annual Report confirms ~85% of FFO is contracted or regulated. BIP raised its distribution for the 17th consecutive year in 2025.
Koninklijke Vopak
The Netherlands
Yield: 4.21%
Dividend CAGR: +11% (3Y)
Vopak owns and operates 77 independent bulk liquid terminals across 23 countries with 35.4 million cubic metres of storage capacity, serving the LNG, ammonia, chemicals, and biofuels supply chains. FY2025 delivered record proportional EBITDA of €1,184M at a 58% margin, record operating free cash flow of €823M, and a 12.5% dividend increase — supported by a 91% portfolio occupancy rate and a €4B growth investment programme committed through 2030. With €1.1B in gas and industrial infrastructure projects under construction across Canada, India, the Netherlands, and Colombia, and a shareholder distributions programme of €1.7B through 2030, Vopak is positioned to capture the structural storage demand created by the global energy transition.
Sources: Global Infrastructure Hub / Oxford Economics, Global Infrastructure Outlook, 2024; UNCTAD, Review of Maritime Transport 2024; World Bank / OECD, Diversifying Global Supply Chains, 2024; International Union of Railways (UIC), Rail Infrastructure Technology Report, 2024; Canada Energy Regulator, Canada’s Energy Future 2024; Reshoring Initiative, 2024 Annual Report. CAGR is Compound Annual Growth Rate.
5
Physical Infrastructure & Essential Services
Waste management · Environmental services · Construction & maintenance · Civic infrastructure
The Investment Thesis
Waste and water infrastructure represents $6 trillion in required global investment through 2040, but its strategic importance extends far beyond its dollar magnitude — touching almost every sector of the economy and every other infrastructure vertical. The UN Environment Programme’s Global Waste Management Outlook 2024 documents that municipal solid waste generation is expected to double from 2.1 billion tons in 2023 to 3.8 billion tons by 2050. Meanwhile, the US ASCE’s 2025 Infrastructure Report Card assigned drinking-water systems a C−grade and wastewater infrastructure a D+, reflecting decades of underinvestment requiring urgent capital deployment.
For investors, waste infrastructure is particularly compelling because of its localized, quasi-monopolistic characteristics. Collection rules, recycling targets, tipping fees, and regulatory approvals vary considerably at the municipal level, making long-term municipal exclusivity agreements — typically 20–30 year terms — the defining commercial feature. These agreements create the contracted revenue visibility that differentiates waste
“Waste infrastructure stands out among infrastructure verticals for its distinctly local nature — municipal exclusivity, provincial permitting, and long-term franchise agreements create barriers to competition that are among the highest in any infrastructure sub-sector.”
— UN Environment Programme, Global Waste Management Outlook 2024
Physical infrastructure construction and maintenance — the enabling layer for all five supercycles — faces a decisive capital deployment moment. The American Society of Civil Engineers estimates that failing to modernize US core infrastructure could cost the US economy $10 trillion in lost GDP by 2039. In Canada, Infrastructure Canada has committed over $180 billion in federal infrastructure investment through the Investing in Canada Plan, creating a decade-long contracted order book for integrated infrastructure operators across public transit, trade corridors, and green infrastructure.
Selected Fund Holdings
Selected Fund Holdings
Waste Connections
Canada
Yield: 0.84%
Dividend CAGR: +13% (5Y)
Waste Connections is North America’s second-largest solid waste company operating under long-term, exclusive municipal franchise agreements. Core pricing grew 6.6% in 2025. The dividend was raised for the 14th consecutive year; the 5-year CAGR of +13% reflects durable franchise pricing power embedded in multi-decade municipal contracts.
Veolia
Environnement
Environnement
France
Yield: 4.27%
Dividend CAGR: +5% (3Y)
Veolia is the world’s largest environmental services group, operating water, waste, and energy services across 215,000 employees in 56 countries. FY2025 revenue reached €44.4B; the 2022 Suez integration drove a ~40% EBITDA step-up, establishing Veolia as the defining global platform for outsourced municipal and industrial environmental infrastructure. Tightening EU Urban Wastewater Treatment Directive requirements and the UN Environment Programme’s Global Waste Management Outlook 2024 create structural regulatory-driven demand across Veolia’s long-term concession and service contracts with municipalities and industrial clients.
Eiffage
France
Yield: 3.80%
Dividend CAGR: +12% (3Y)
Eiffage operates motorway and high-speed rail concessions alongside construction, civil works, and energy systems across Europe. Its Aliénor and APRR motorway concessions provide inflation-linked contracted cash flows under 50+ year government agreements. The EIB’s 2024 infrastructure report identifies France as Europe’s largest PPP market; Eiffage’s energy systems division is a direct beneficiary of grid modernisation investment across the Continent.
Aecon Group
Canada
Yield: 3.80%
Dividend CAGR: +2% (3Y)
Aecon is Canada’s largest publicly traded construction and infrastructure developer, building assets across all five fund supercycles. Aecon participates in Canada’s CANDU nuclear refurbishment programme under multi-year, government-backed contracts — the CNSC identifies Darlington and Bruce refurbishments as critical national infrastructure investments through the 2030s. Infrastructure Canada’s Investing in Canada Plan provides Aecon with a contracted project pipeline exceeding C$6B in backlog as at Q4 2025.
Sources: UN Environment Programme, Global Waste Management Outlook 2024; US ASCE, 2025 Infrastructure Report Card; US EPA, PFAS National Primary Drinking Water Regulation, 2024; European Investment Bank, Infrastructure Financing in Europe, 2024; Infrastructure Canada, Investing in Canada Plan Progress Report, 2024; Canadian Nuclear Safety Commission, Refurbishment Regulatory Programme Documentation. CAGR is Compound Annual Growth Rate.
Conclusion: The Infrastructure Decade
A convergence of technological change, demographic pressure, geopolitical realignment, and climate imperative is creating a genuine inflection point in global infrastructure investment. The Global Infrastructure Hub projects $106 trillion in required cumulative investment by 2040. BloombergNEF documents that clean energy investment alone reached $2.3 trillion in 2025 and is projected to average $2.9 trillion annually through 2030. The IEA estimates energy infrastructure investment must more than double annually to meet decarbonization targets. Each of these independent institutional projections points to the same conclusion: the current decade is the most significant infrastructure investment window of the modern era.
The Starlight Global Infrastructure Fund’s five-supercycle framework maps directly to the most capital-intensive verticals in this investment cycle: $36 trillion in transportation and logistics (4), $23 trillion in energy and power (2 and 3), and $19 trillion in digital infrastructure (1), with the physical infrastructure and essential services of waste and environmental services (5) providing portfolio ballast through their locally contracted, quasi-monopolistic cash flows.
The Starlight Global Infrastructure Fund’s five-supercycle framework maps directly to the most capital-intensive verticals in this investment cycle: $36 trillion in transportation and logistics (4), $23 trillion in energy and power (2 and 3), and $19 trillion in digital infrastructure (1), with the physical infrastructure and essential services of waste and environmental services (5) providing portfolio ballast through their locally contracted, quasi-monopolistic cash flows.
“Private infrastructure assets under management surged from approximately $500 billion in 2016 to $1.5 trillion in 2024. Nearly half of limited partners surveyed intend to increase infrastructure allocations, attracted by predictable cash flows, inflation protection, and strategic alignment with digitalization and energy transition trends.”
— McKinsey & Company, Global Private Markets Report 2025: Braced for Shifting Weather, May 2025
For Canadian investors seeking an income-generating, inflation-protected allocation to the most durable structural investment theme of the next decade, the Starlight Global Infrastructure Fund Series F offers a tax-efficient 4.48% distribution yield*, with 86.8% of the distribution treated as return of capital for tax purposes in 2025. The portfolio generated 34 dividend and distribution increases in 2025 with an average increase of 13.6%. Finally, the cross-vertical portfolio construction positions unitholders to benefit from the full breadth of this $106 trillion investment opportunity.
*Based on NAV as of March 31, 2026
Real Assets
Starlight Global Infrastructure Fund
Inception — 2018
Investment Objective:
To provide regular current income by investing globally in companies with either direct or indirect exposure to infrastructure.
Distribution Frequency
Fixed Monthly
Fund Codes / Ticker
Series A (SLC102)
Series F (SLC202)
Series FT6 (SLC252)
Series T6 (SLC152)
Series ETF (SCGI)
Investment Objective:
To provide regular current income by investing globally in companies with either direct or indirect exposure to infrastructure.
Distribution Frequency
Fixed Monthly
Fund Codes / Ticker
Series A (SLC102)
Series F (SLC202)
Series FT6 (SLC252)
Series T6 (SLC152)
Series ETF (SCGI)
The views in this update are subject to change at any time based upon market or other conditions and are current as of April 24, 2026. While all material is deemed to be reliable, accuracy and completeness cannot be guaranteed.
Certain statements in this document are forward-looking. Forward-looking statements (“FLS”) are statements that are predictive in nature, depend upon or refer to future events or conditions, or that include words such as “may,” “will,” “should,” “could,” “expect,” “anticipate,” “intend,” “plan,” “believe,” or “estimate,” or other similar expressions. Statements that look forward in time or include anything other than historical information are subject to risks and uncertainties, and actual results, actions or events could differ materially from those set forth in the FLS. FLS are not guarantees of future performance and are by their nature based on numerous assumptions. Although the FLS contained herein are based upon what Starlight Capital and the portfolio manager believe to be reasonable assumptions, neither Starlight Capital nor the portfolio manager can assure that actual results will be consistent with these FLS. The reader is cautioned to consider the FLS carefully and not to place undue reliance on FLS. Unless required by applicable law, it is not undertaken, and specifically disclaimed that there is any intention or obligation to update or revise FLS, whether as a result of new information, future events or otherwise. Investment funds are not guaranteed, their values change frequently, and past performance may not be repeated.
The content of this document (including facts, views, opinions, recommendations, descriptions of or references to, products or securities) is not to be used or construed as investment advice, as an offer to sell or the solicitation of an offer to buy, or an endorsement, recommendation or sponsorship of any entity or security cited. Although we endeavour to ensure its accuracy and completeness, we assume no responsibility for any reliance upon it. Commissions, trailing commissions, management fees and expenses all may be associated with investment funds. Please read the offering documents before investing. Investors should consult with their advisors prior to investing.
Starlight, Starlight Investments, Starlight Capital and all other related Starlight logos are trademarks of Starlight Group Property Holdings Inc.