Starlight Perspectives: Dividend Growth Investing
Long-Term Equity Returns and the Power of Dividends
There are three sources of return from any equity investment - the dividend it pays, the growth the company generates and the multiple that the company trades at. Over short periods of time, returns are dominated by the change in the multiple that equities trade at. This can be in response to earnings, central bank monetary policy, government fiscal policy or any other macroeconomic events. Over longer periods of time, total returns are dominated by the dividends and growth that the company generates. Exhibit 1 shows this effect and underlines the benefits of focusing on companies that can grow their earnings and are focused on returning capital to investors
Exhibit 1 – Return Generator by Time Horizon for Every 1-Year and 5-Year Period Since 1871
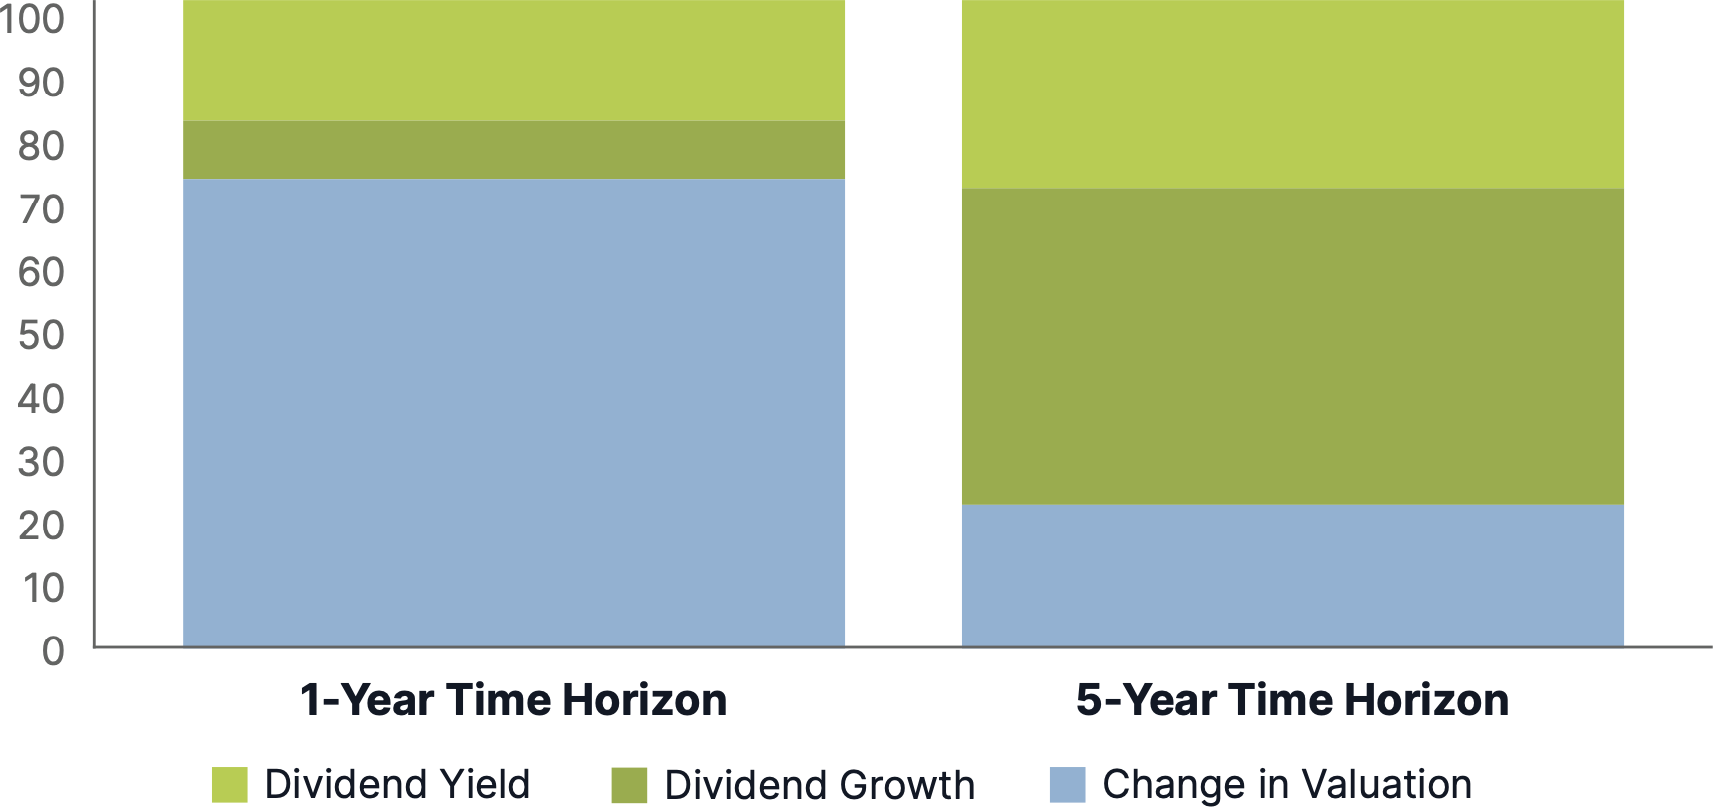
Source: Bristol Gate Capital Partners
Starlight Capital’s Approach to Dividend Investing: Dividend Growth Investing
Investors understand the benefits of receiving dividends from companies as one of the sources of total return. Starlight Capital is focused on companies that consistently grow their dividend based on consistent growth in earnings and cash flows. These companies have historically generated superior long-term total returns and have tended to do so with lower overall volatility. This point is important as it allows investors to hold onto their positions for longer during periods of elevated volatility. Exhibit 2 demonstrates the significant outperformance of dividend growth stocks over the last 50 years.
Exhibit 2 - Dividend Growth Stocks Have Outperformed with Less Risk
Risk vs return, annualized, 1973 - 2022
Risk vs return, annualized, 1973 - 2022
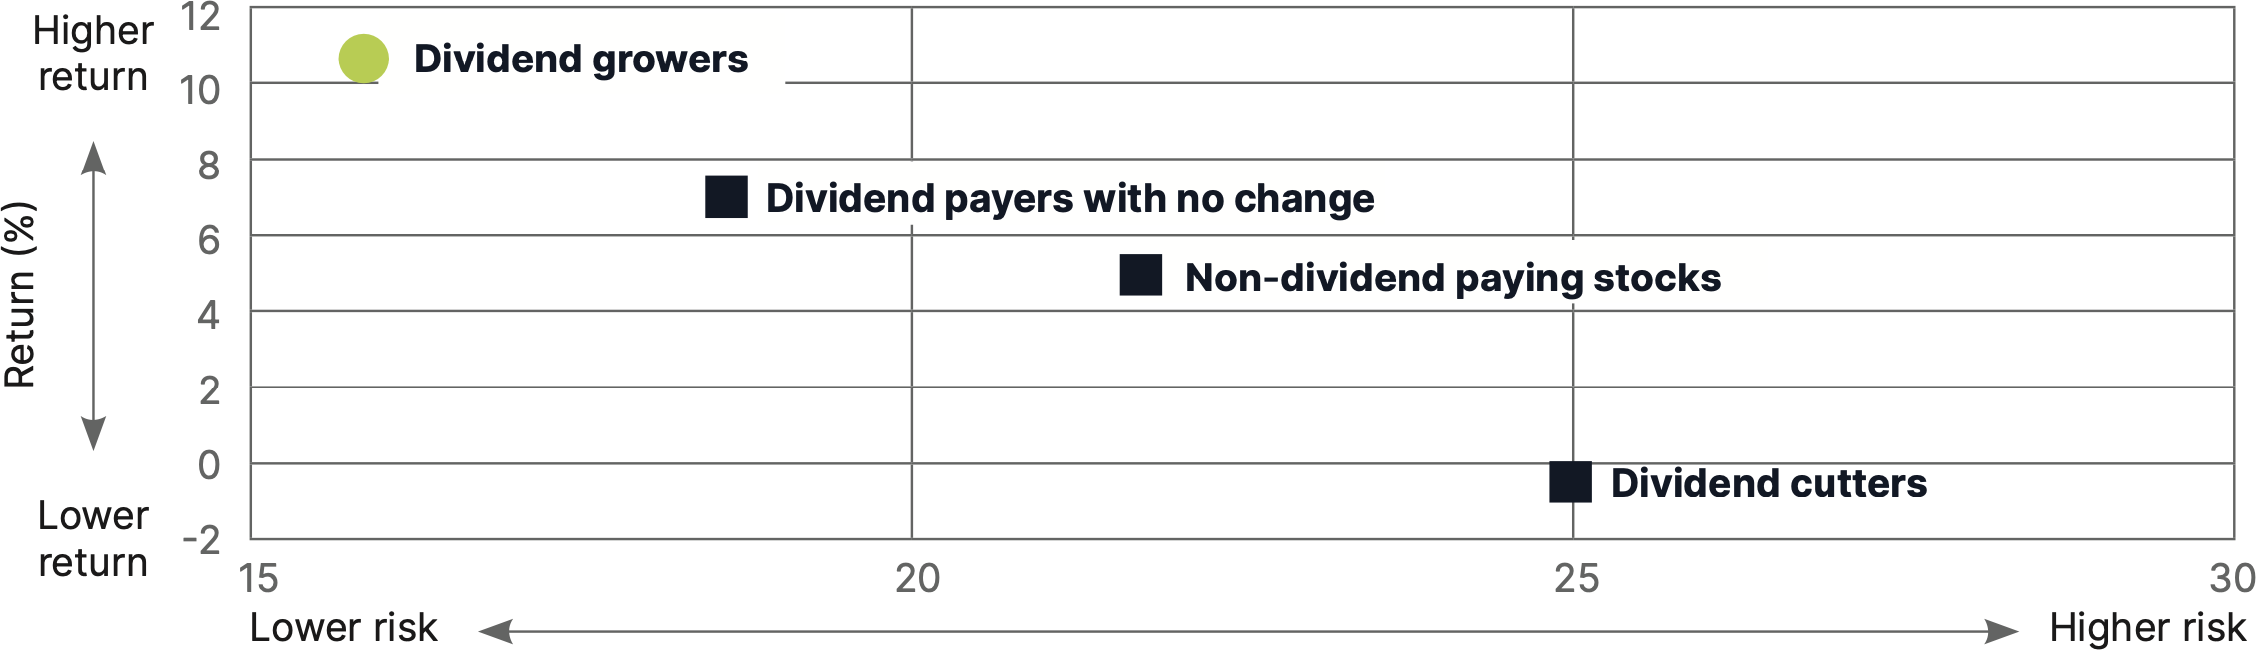
Source: Ned Davis Research, Inc. and Refinitiv, 31 Jan 1973 –31 Dec 2021. Past Performance is no guarantee of future results. Performance represents the historical risk/return performance of S&P 500 stocks grouped by dividend policies.
Why Invest in Dividend-Growing Companies?
A business must have consistent and growing net earnings before it can implement and then consistently grow its dividend. Consistently rising net earnings are generally the result of an enduring competitive advantage that has not been competed away. This can be anything from Coca-Cola’s brand to Microsoft’s omnipresence to CN Rail’s tracks to regulated monopolies of public goods (electricity, water, gas). All of these are examples of great businesses with irreplaceable assets that possess an enduring competitive advantage.
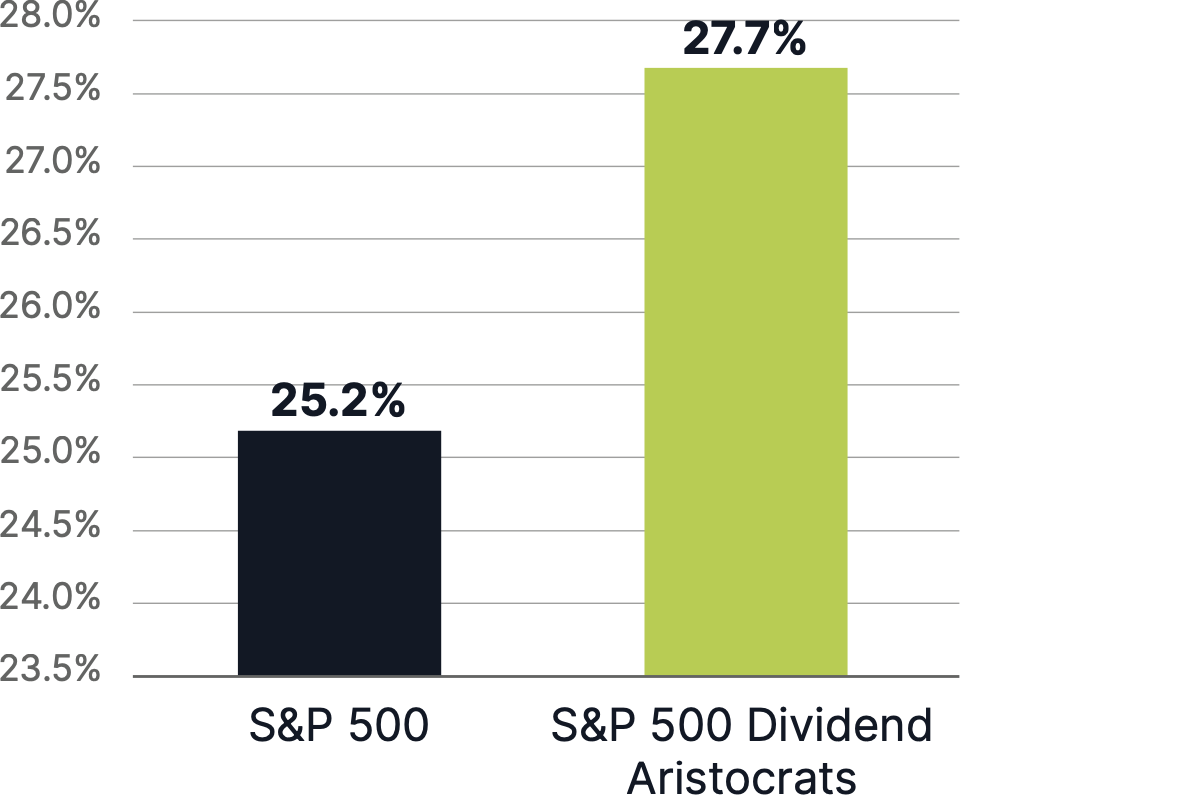
The S&P 500 Dividend Aristocrats are an elite group of large-cap companies that have increased their dividends for at least 25 consecutive years. Exhibit 3 provides evidence that these companies have consistently generated higher returns on equity than the companies in the S&P 500. The difference is even more striking when we look at quarterly earnings growth. In Q4 2022 the S&P 500 saw material earnings declines while the Dividend Aristocrats enjoyed very strong earnings growth.
The S&P 500 Dividend Aristocrats are an elite group of large-cap companies that have increased their dividends for at least 25 consecutive years. Exhibit 3 provides evidence that these companies have consistently generated higher returns on equity than the companies in the S&P 500. The difference is even more striking when we look at quarterly earnings growth. In Q4 2022 the S&P 500 saw material earnings declines while the Dividend Aristocrats enjoyed very strong earnings growth.
Exhibit 3 – S&P 500 Dividend Aristocrats Return on Equity and Earnings Growth
Dividend Aristocrats Have Produced Higher Returns on Equity
...and More Resilient Earnings Growth
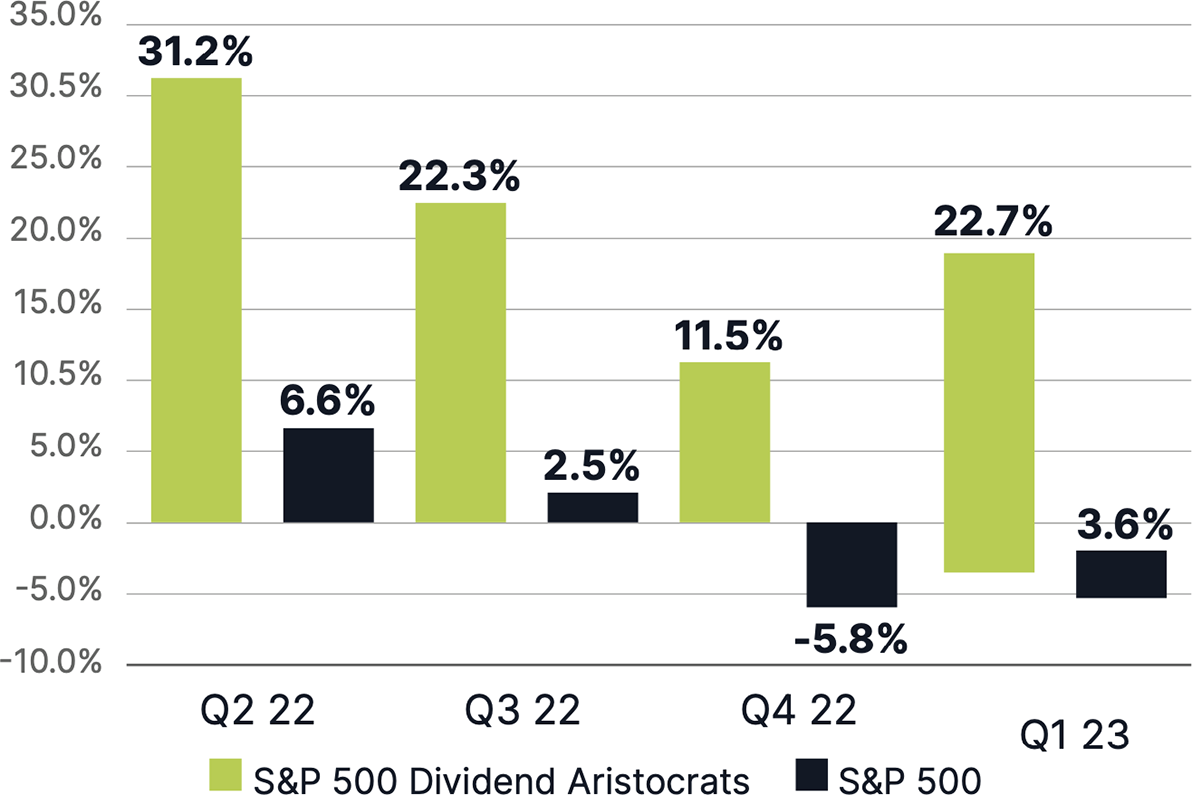
Source: FactSet, 3/1/22-4/20/23. Return on equity measures how efficiently a company generates profits and equals a company’s net income divided by shareholders’ equity. CY is defined as current calendar year. Index returns are for illustrative purposes only and do not represent fund performance. Index performance returns do not reflect any management fees, transaction costs or expenses. Indexes are unmanaged, and one cannot invest in an index. Past performance does not guarantee future results.
Beware of Unsustainable Payouts
Some companies use financial engineering (rising payout ratio, rising leverage) in order to generate rising dividends. This is not sustainable over the long-term and we screen these businesses out during our analysis. These companies often start off as dividend growers and/or high yield stocks but often become dividend cutters when economic (i.e. recession) or financial (i.e. rapidly rising interest rates) adversity arises. Starlight Capital targets companies that can continue to grow their dividends through full business and economic cycles, based on their ability to grow their net earnings. As Exhibit 4 demonstrates, Dividend Aristocrats provide materially more downside protection compared to High Dividend equities and the S&P Composite 1500® in aggregate.
Exhibit 4 - Dividend Growers versus High Dividend Payers in Down Markets
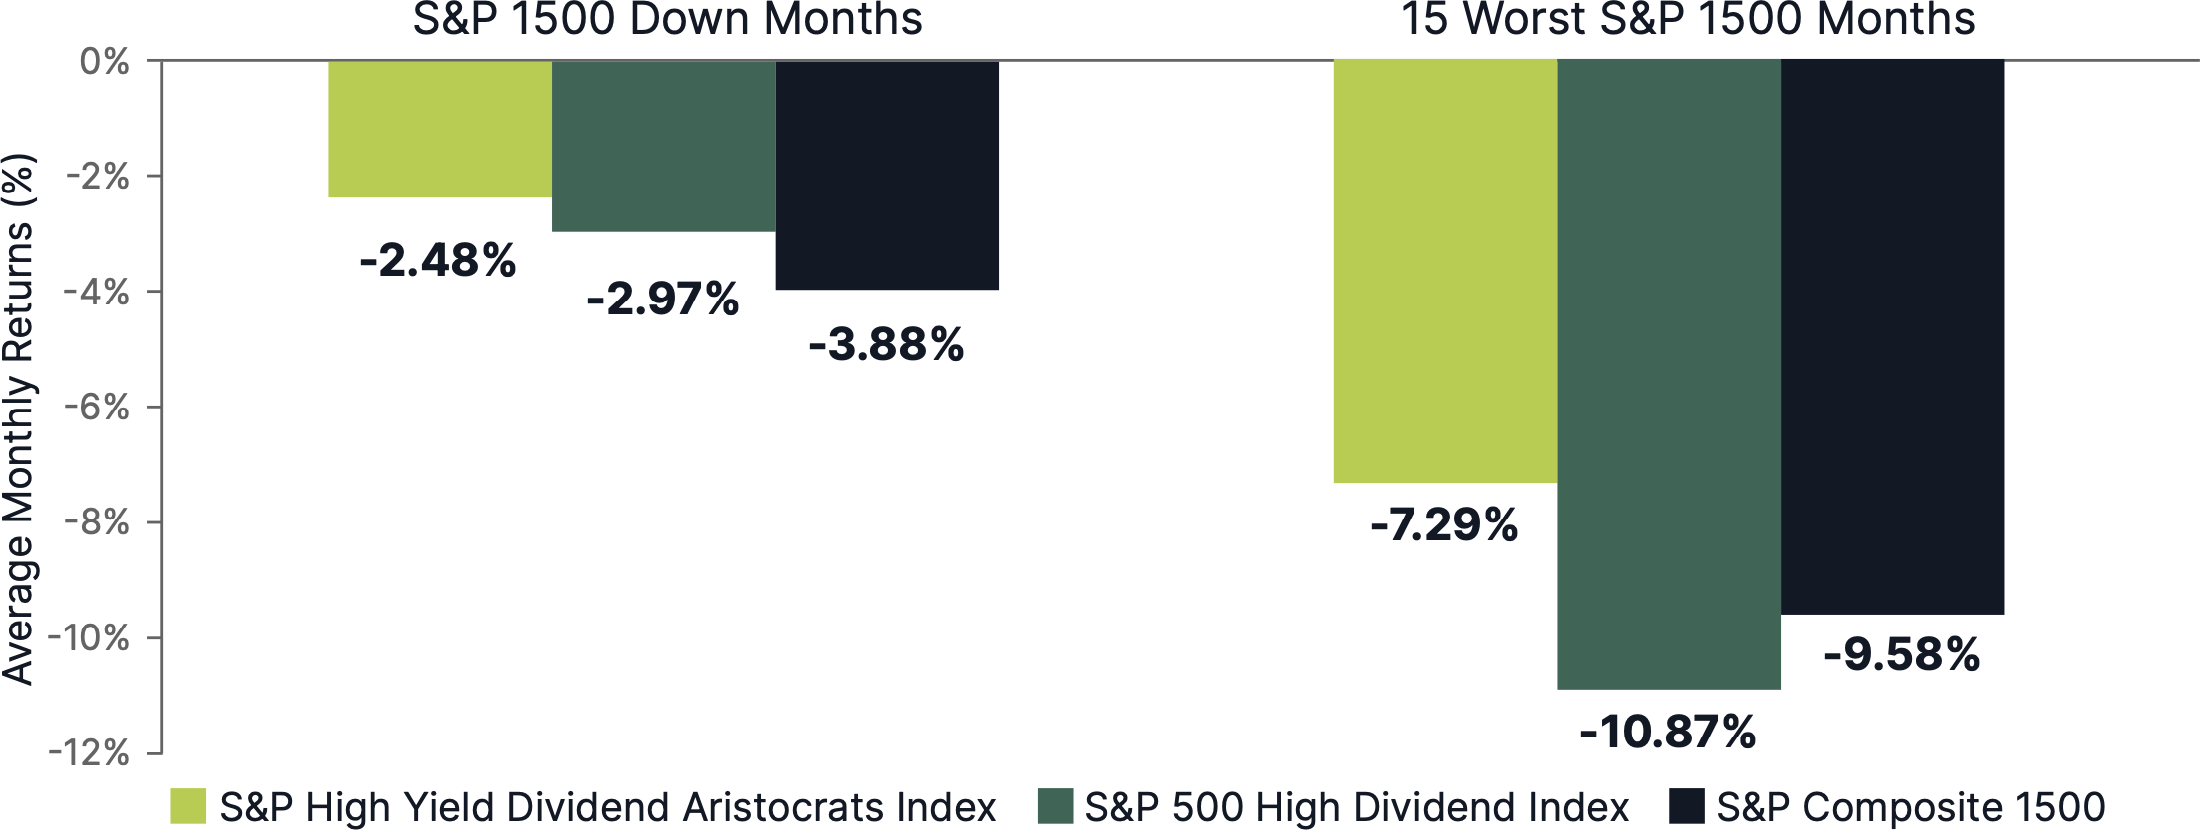
Source: S&P Dow Jones Indices LLC. Data from Dec. 31. 1999, to March 31, 2022. Index performance based on total return in USD. Past performance is no guarantee of future results. The S&P High Yield Dividend Aristocrats was launched Nov. 9, 2005. The S&P 500 High Dividend Index was launched Sept. 21, 2015. All data prior to the index launch date is back-tested hypothetical performance. Chart is provided for illustrative purposes and reflects hypothetical historical performance. Please see the Performance Disclosure at the end of this document for more information regarding the inherent limitations associated with back- tested performance.
Small and Mid-Cap Dividend Growers Advantage
Many investors have incorporated small/mid capitalization stocks strategically into their portfolios for the diversification benefits and the potential for higher returns. Since 1926, small/mid capitalization stocks have outperformed large caps on a nominal basis however, these returns have historically come with greater risk as measured by volatility. The story is very different for small/mid cap dividend growers, as they have experienced both lower volatility and lower drawdowns, compared with the overall small/mid cap universe. Exhibit 5 shows that small/mid cap dividend growers likely owe this outperformance to their ability to generate higher returns on equity and earnings per share growth.
Exhibit 5 - Small Cap Dividend Growers: Higher ROEs & Growth, Better Upside/Downside Capture
Index Dividend Growers Delivered Strong Up/Down Capture Ratios
(Inception - June 30, 2022)
Index Dividend Growers Delivered Strong Up/Down Capture Ratios
(Inception - June 30, 2022)
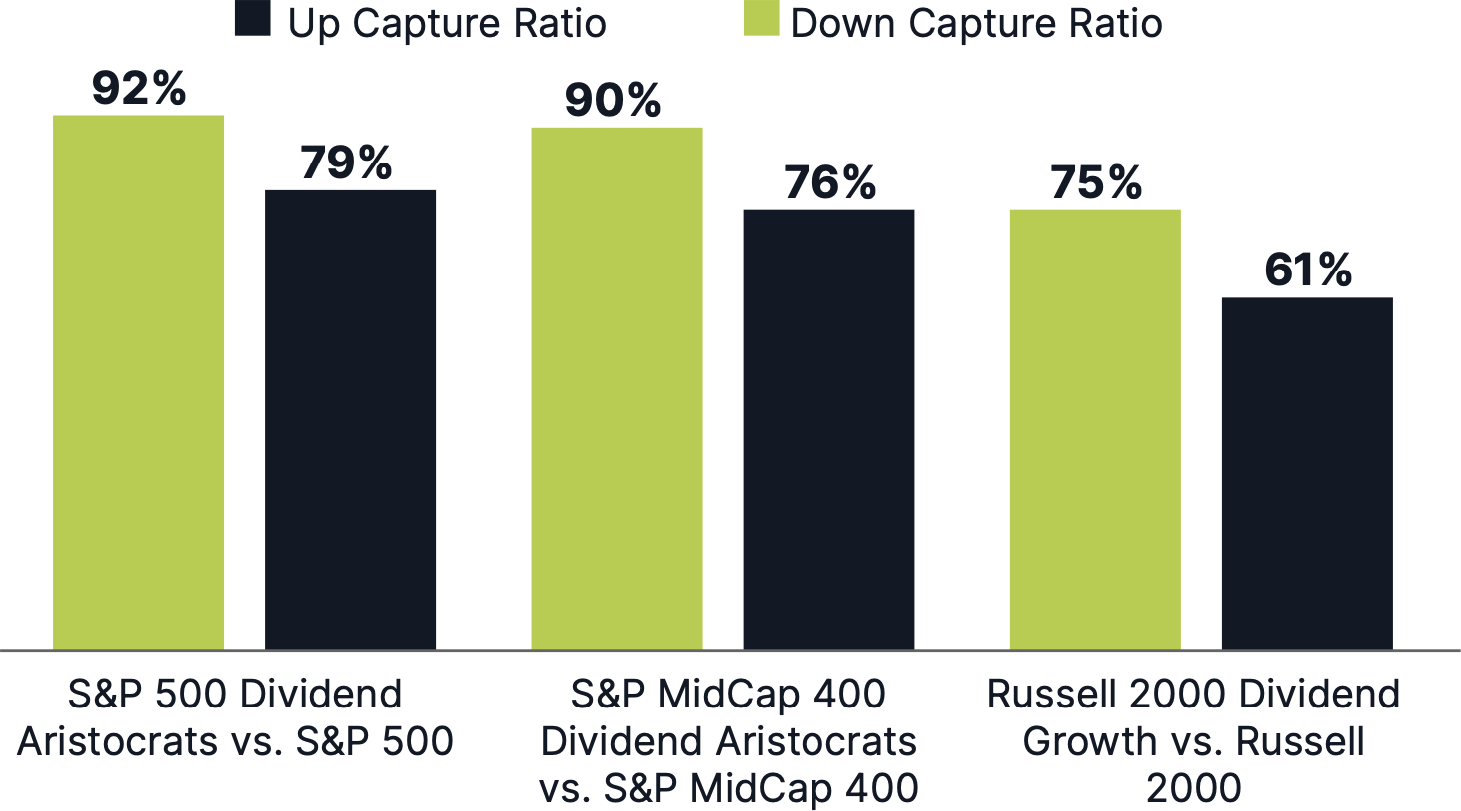
Source: Morningstar. Data as of 6/30/2022. Index returns are for illustrative purposes only and do not reflect any management fees, transaction costs or expenses. Indexes are unmanaged and one cannot invest directly in an index. Past performance does not guarantee future results. S&P 500 Dividend Aristocrats: 5/2/05 - 6/30/22. S&P MidCap 400 Dividend Aristocrats: 1/5/15 -6/30/22. Russell 2000 Dividend Growth: 11/11/14 - 6/30/22.
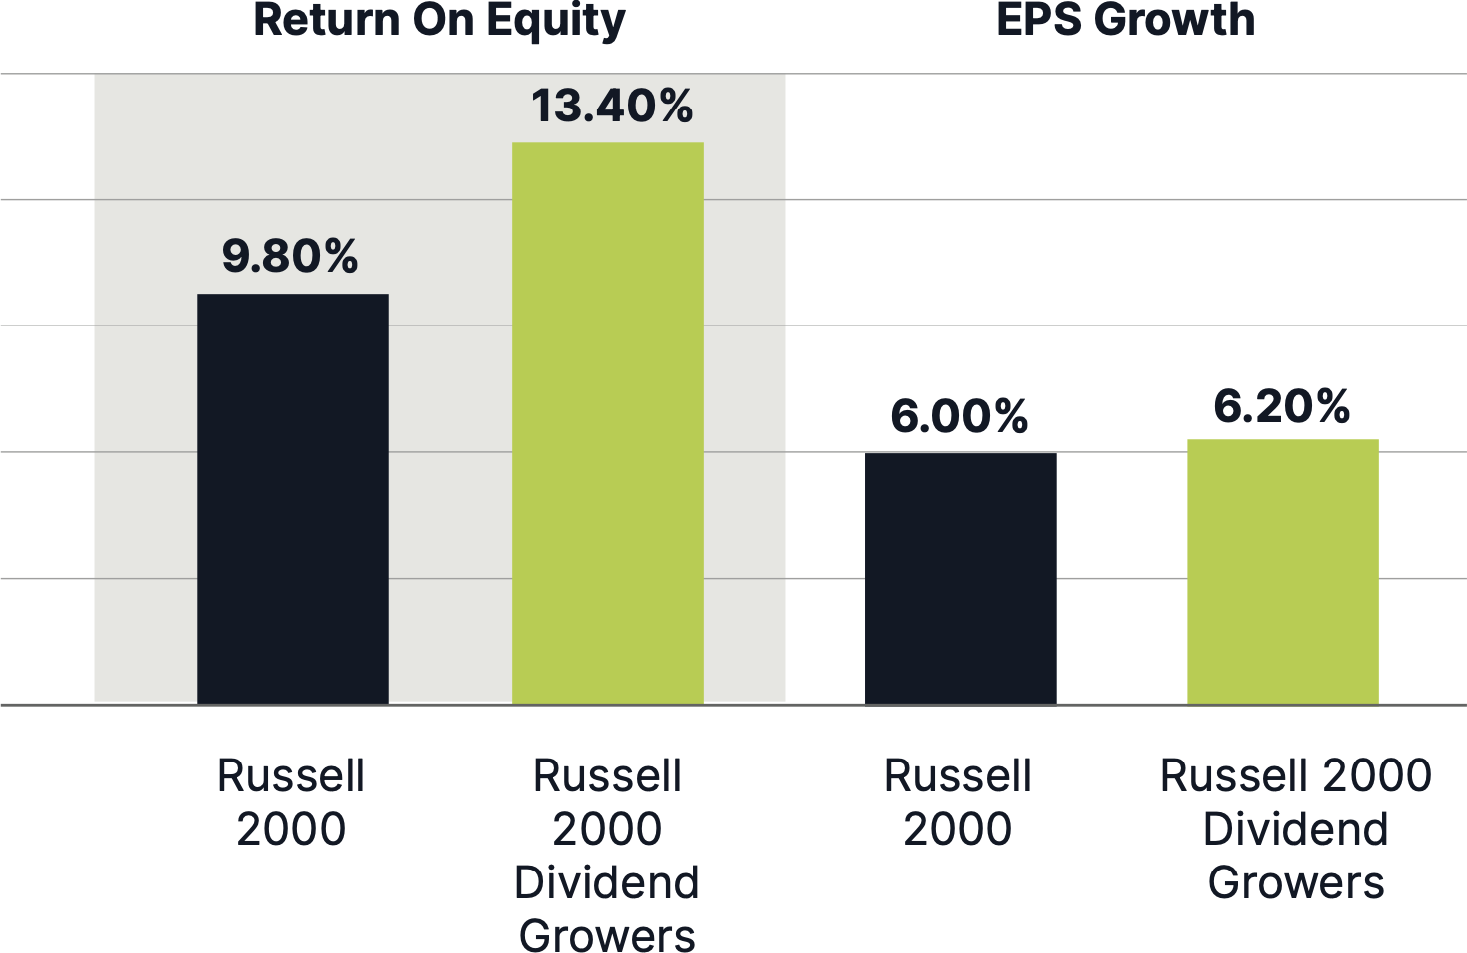
Source: Russell Investment Group. Return on Equity (ROE) is based on the 5-year average for the period ending 12/31/2014. Earnings per share (EPS) is the portion of a company’s profit allocated to each outstanding share of common stock; it serves as an indicator of a company’s profitability. Here, EPS is calculated for the last 10 years ending 12/31/2014.
All-Weather Portfolios Start with Dividend Growth Stocks
Dividend growth stocks play a critical role in delivering resilience across economic cycles. These companies, typically established, cash-generative businesses with long records of consistent dividend increases, offer a combination of income, quality, and capital preservation. In volatile markets or uncertain macroeconomic environments, their ability to return capital to shareholders serves as both a buffer and a signal of management confidence.
Unlike high-yield stocks that may sacrifice long-term growth for current income, dividend growth stocks are often industry leaders with strong balance sheets and durable competitive advantages. Their consistent reinvestment in core operations and disciplined capital allocation help drive both cash flow and dividend growth, compounding investor returns over time.
In an all-weather portfolio, these stocks contribute meaningfully to total return, especially when capital appreciation is muted. During downturns, their stability and income generation can help offset losses in more cyclical or speculative holdings. In upcycles, they provide participation in market gains while maintaining defensive characteristics.
Sectors such as consumer staples, industrials, and healthcare, with secular demand drivers and pricing power, are home to many dividend growth companies. These companies have historically raised dividends through various economic environments, underscoring their role in anchoring long-term portfolios with both growth and downside protection.
Starlight Dividend Growth Class: Targeting 10%+ Sustainable Dividend Growth
Starlight Dividend Growth Class offers investors access to a diversified portfolio of North American dividend growth companies, targeting a sustainable 10%+ annual dividend growth rate. The Fund also offers exposure to high-quality U.S. small/mid caps with rising dividends, and Healthcare and Technology companies not widely available in the Canadian market. All this while also reducing exposure to the Financials, Energy and Materials sectors that dominate the Canadian market.
Starlight Capital was founded to provide Canadian investors with the ability to invest in dividend growth mandates to drive superior, long-term risk-adjusted total returns. Starlight Dividend Growth Class has generated a 20+ year track record of strong performance. Driving this performance is the focus on dividend growers and our proprietary investment philosophy that focuses on high-quality companies with enduring competitive advantages. The Fund is used as a core holding for Canadian portfolios, complementing all investment styles.
Starlight Capital was founded to provide Canadian investors with the ability to invest in dividend growth mandates to drive superior, long-term risk-adjusted total returns. Starlight Dividend Growth Class has generated a 20+ year track record of strong performance. Driving this performance is the focus on dividend growers and our proprietary investment philosophy that focuses on high-quality companies with enduring competitive advantages. The Fund is used as a core holding for Canadian portfolios, complementing all investment styles.
Access Dividend Growth with Starlight Capital
Starlight Capital is an independent Canadian asset management firm with over $1 billion in assets under management. We manage Global and North American diversified private and public equity investments across traditional and alternative asset classes, including real estate, infrastructure and private equity. Our goal is to deliver superior risk-adjusted, total returns to investors through a disciplined investment approach: Focused Business Investing.
Focused Business Investing means we invest in great businesses when they offer us enough return for the risk we are exposed to. Great businesses are characterized by strong recurring cash flow, irreplaceable assets, low leverage, and strong management team. The result is concentrated portfolios of great businesses that reward investors with rising dividends.
Diversified Equities
Starlight Dividend Growth Class
Inception—2003
Investment Objective:
To achieve above average long-term capital growth that is consistent with a conservative investment philosophy encompassing a diversified portfolio approach. The Fund invests primarily in equity securities of Canadian companies that demonstrate financial strength and good growth potential.
Fund Codes
Series A (SLC515)
Series F (SLC517)
Series FT6 (SLC5176)
Series FT8 (SLC5178)
Series T8 (SLC5158)
Series PTF (SCDGC)
Series ETF (SCDG)
Distribution Frequency
Monthly
Important disclaimer.
The views in this update are subject to change at any time based upon market or other conditions and are current as of June 16, 2025. While all material is deemed to be reliable, accuracy and completeness cannot be guaranteed.
Certain statements in this document are forward-looking. Forward-looking statements (“FLS”) are statements that are predictive in nature, depend upon or refer to future events or conditions, or that include words such as “may,” “will,” “should,” “could,” “expect,” “anticipate,” “intend,” “plan,” “believe,” or “estimate,” or other similar expressions. Statements that look forward in time or include anything other than historical information are subject to risks and uncertainties, and actual results, actions or events could differ materially from those set forth in the FLS. FLS are not guarantees of future performance and are by their nature based on numerous assumptions. Although the FLS contained herein are based upon what Starlight Capital and the portfolio manager believe to be reasonable assumptions, neither Starlight Capital nor the portfolio manager can assure that actual results will be consistent with these FLS. The reader is cautioned to consider the FLS carefully and not to place undue reliance on FLS. Unless required by applicable law, it is not undertaken, and specifically disclaimed that there is any intention or obligation to update or revise FLS, whether as a result of new information, future events or otherwise. Investment funds are not guaranteed, their values change frequently, and past performance may not be repeated.
The content of this document (including facts, views, opinions, recommendations, descriptions of or references to, products or securities) is not to be used or construed as investment advice, as an offer to sell or the solicitation of an offer to buy, or an endorsement, recommendation or sponsorship of any entity or security cited. Although we endeavour to ensure its accuracy and completeness, we assume no responsibility for any reliance upon it. Commissions, trailing commissions, management fees and expenses all may be associated with investment funds. Please read the offering documents before investing. Investors should consult with their advisors prior to investing.
Starlight, Starlight Investments, Starlight Capital and all other related Starlight logos are trademarks of Starlight Group Property Holdings Inc.