Payment networks—global e-commerce leverage produces cash flow and dividend growth
Payment networks facilitate financial transactions for consumers and businesses over their global networks. Their primary revenue source is fees charged to participating banks based on transaction numbers and dollar volumes. Some payment network firms may also charge fees for clearing and settling transactions for financial services firms. International transactions represent a premium revenue source as the currency conversion creates additional complexity. Finally, licensing of trademarks and additional services for premium or affinity cards creates additional revenue streams.
Most debit and credit transactions involve two different financial institutions - the Acquirer bank and the Issuer bank. The Issuer bank is the financial institution that provided the debit or credit card to the consumer. The Issuer bank is exposed to credit risk and potential fraud and their fee compensates them for these risks. The Acquirer bank is the financial institution that the merchant has partnered with to accept credit and debit transactions. The Acquirer bank performs this service for a fee.
When a consumer makes a credit purchase, the merchant does not receive the full transaction value from the financial institution. Instead, the merchant is subject to the Merchant Discount Fee (“MDF”) which is paid to the Issuer and Acquirer banks. The largest component of the MDF is the Interchange Fee which is paid to the Issuer bank to compensate them for absorbing the credit and fraud risk involved in the transaction. The Acquirer bank receives a much smaller processing fee for facilitating the transaction on behalf of the merchant. The payment network then receives fees depending on the amount of services they provide to the Issuer and Acquirer bank involved in the transactions.
Transfer of fees in a credit card transaction

Source: GAO (analysis); Art Explosion (images).
Merchant and consumer lobby groups have attempted to sue card issuers and payment networks, over what they see as artificially high interchange fees. The Payment Card Interchange Fee and Merchant Discount Antitrust Litigation is a class action lawsuit filed in 2005. A record settlement between U.S. $5.54 billion and $6.24 billion was reached in 2018 however, many retailers are expected to opt out and further litigation to change payment network business conduct is expected. It is important to note that while the payment networks set and collect the interchange fee, they are not paid out of the interchange fee. A lower interchange fee would certainly decrease revenues for banks, but the main driver of payment network revenue is the fees charged based on the number of transactions and dollar volumes. Globally, both number of transactions and dollar volumes continue to trend up by double digits.
Digital “currencies” like Bitcoin have gained much attention and some businesses have begun to accept them as payment. However, it’s important to note that in the U.S., cash remains the dominant form of payment instrument, used for 30% of all transactions in 20171. Amazon may be the future of retail but for now, 77% of all payments in the U.S. in 2017 were made in- person and cash was still the dominant payment form, accounting for 39% of the volume of payments. These numbers indicate that while payment networks capture a tremendous amount of global payment traffic, they still have significant room to grow.
Most consumers are familiar with the dominant global payment network operators -Visa Inc. (“Visa”), Mastercard Inc. (“Mastercard”), Discover Financial Services Inc. (“Discover”) and American Express Company (“Amex”). However, there are distinct differences in the operating models of the payment network operators that present different risk and return profiles.
Discover and Amex are bank holding companies, subject to the Banking Act and regulated by the Federal Deposit Insurance Company (“FDIC”) and the Federal Reserve Bank (“Fed”). Both companies are deposit-taking institutions with loan books and capital requirements and are part of the Financials subsector of the Global Industry Classifications Standard (“GICS”). Discover and Amex issue their own cards and are exposed to lending and interest rate risk in their daily operations. These firms compete with Visa and Mastercard as global payment network operators, but they also compete with JP Morgan Chase & Co., Citigroup Inc., Bank of America Corp. and Capital One Financial Corp. as card Issuers and bank holding companies.
1Source: Rapport Diary of Consumer Payment Choice (DCPC), Federal Reserve System.
Global payments revenues are forecast to grow 9 percent annually from 2017 through 2022.

Source: McKinsey Global Payments Map
In contrast, Visa and Mastercard can be looked at as pure play payment network businesses. They do not issue their own cards, rather they license their brands to banks who then issue dual branded cards (i.e. CIBC Visa). Neither company takes deposits or lends to consumers or businesses -they are both technology- driven businesses and accordingly are in the Information Technology subsector of the GICS. We consider payment networks infrastructure since they provide an essential service to the global economy, within an oligopolistic industry structure with extremely high barriers to entry.
Visa is the largest global payment network with U.S. $11.2 trillion of total payments volume in 2018. Visa’s networks processed 124.3 billion transactions in 2018 (68.3% market share) and there are 3.3 billion Visa cards in circulation globally. In 2018 Visa experienced 11% payments volume growth, 10% cross-border volume growth and 12% processed transactions growth. Visa generated U.S. $12 billion in adjusted free cash flow in 2018 and returned U.S. $9.1 billion to shareholders, via dividends and share buybacks2.
For 2019 Visa guided towards low double-digit revenue growth and mid-teens diluted adjusted earnings per share growth. These growth rates are supported by a number of global macro trends. E-commerce is growing at 3-4x the rate of total retail sales. E-commerce card penetration is high in the U.S. at 60% however Canada is currently 75% and still rising3. In contrast, Brazil and Mexico are only at 35% and 16% respectively, indicating that global payments volumes can continue to grow at double-digit rates for many years to come4.
Since its IPO in 2008 Visa has generated over 9x the return of the S&P 500 and year-to-date has delivered a 37.6% total return to investors. While Visa now trades at an all-time high price-earnings multiple, we see only modest near-term downside risk given the strong global payments market growth and Visa’s dominant position in the industry.
2 Source: Visa Inc. Fiscal Fourth Quarter 2018 Financial Results.
3 Source: U.S. Payments: Duopoly of Disruption and Digitization – Initiating Coverage with a new lens, Bernstein, 27 March 2018
4 Source: As of August 1, 2019. Bloomberg L.P.McKinsey Global Payments Map
3 Source: U.S. Payments: Duopoly of Disruption and Digitization – Initiating Coverage with a new lens, Bernstein, 27 March 2018
4 Source: As of August 1, 2019. Bloomberg L.P.McKinsey Global Payments Map
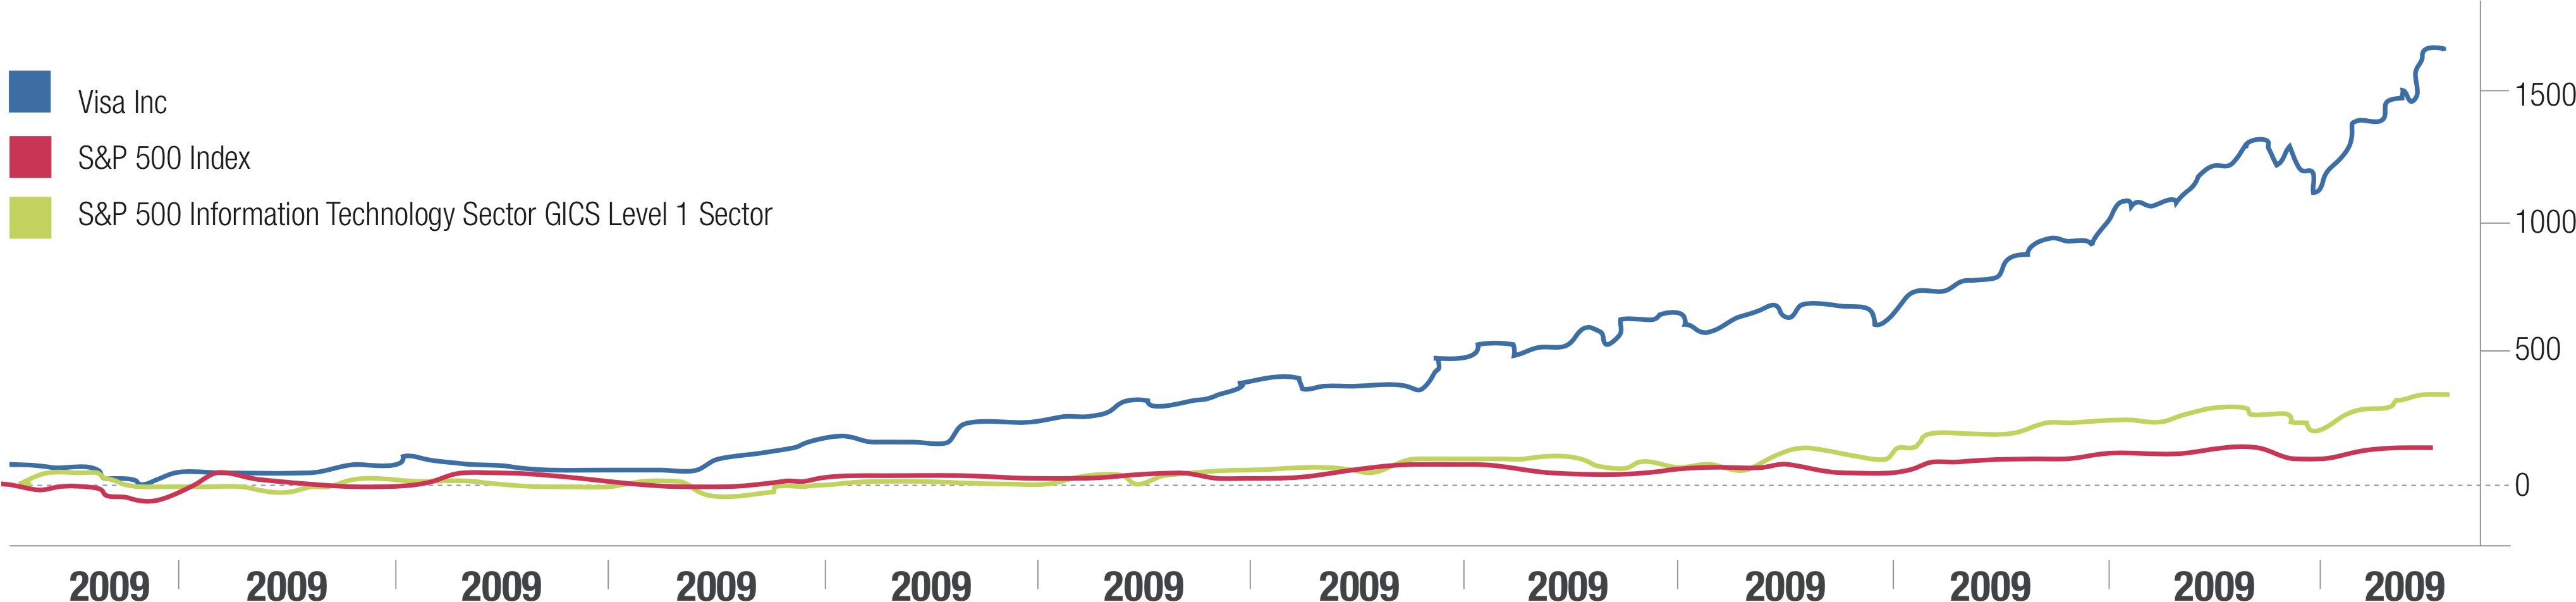
Source: Bloomberg LP. From March 18, 2008 to August 1, 2019.
Certain statements in this document are forward-looking. Forward-looking statements (“FLS”) are statements that are predictive in nature, depend upon or refer to future events or conditions, or that include words such as “may,” “will,” “should,” “could,” “expect,” “anticipate,” “intend,” “plan,” “believe,” or “estimate,” or other similar expressions. Statements that look forward in time or include anything other than historical information are subject to risks and uncertainties, and actual results, actions or events could differ materially from those set forth in the FLS. FLS are not guarantees of future performance and are by their nature based on numerous assumptions. Although the FLS contained herein are based upon what Starlight Capital and the portfolio manager believe to be reasonable assumptions, neither Starlight Capital nor the portfolio manager can assure that actual results will be consistent with these FLS. The reader is cautioned to consider the FLS carefully and not to place undue reliance on FLS. Unless required by applicable law, it is not undertaken, and specifically disclaimed that there is any intention or obligation to update or revise FLS, whether as a result of new information, future events or otherwise.
Commissions, trailing commissions, management fees and expenses all may be associated with investment funds. Please read the prospectus before investing. Investment funds are not guaranteed, their values change frequently, and past performance may not be repeated.
Starlight, Starlight Investments, Starlight Capital and all other related Starlight logos are trademarks of Starlight Group Property Holdings Inc.