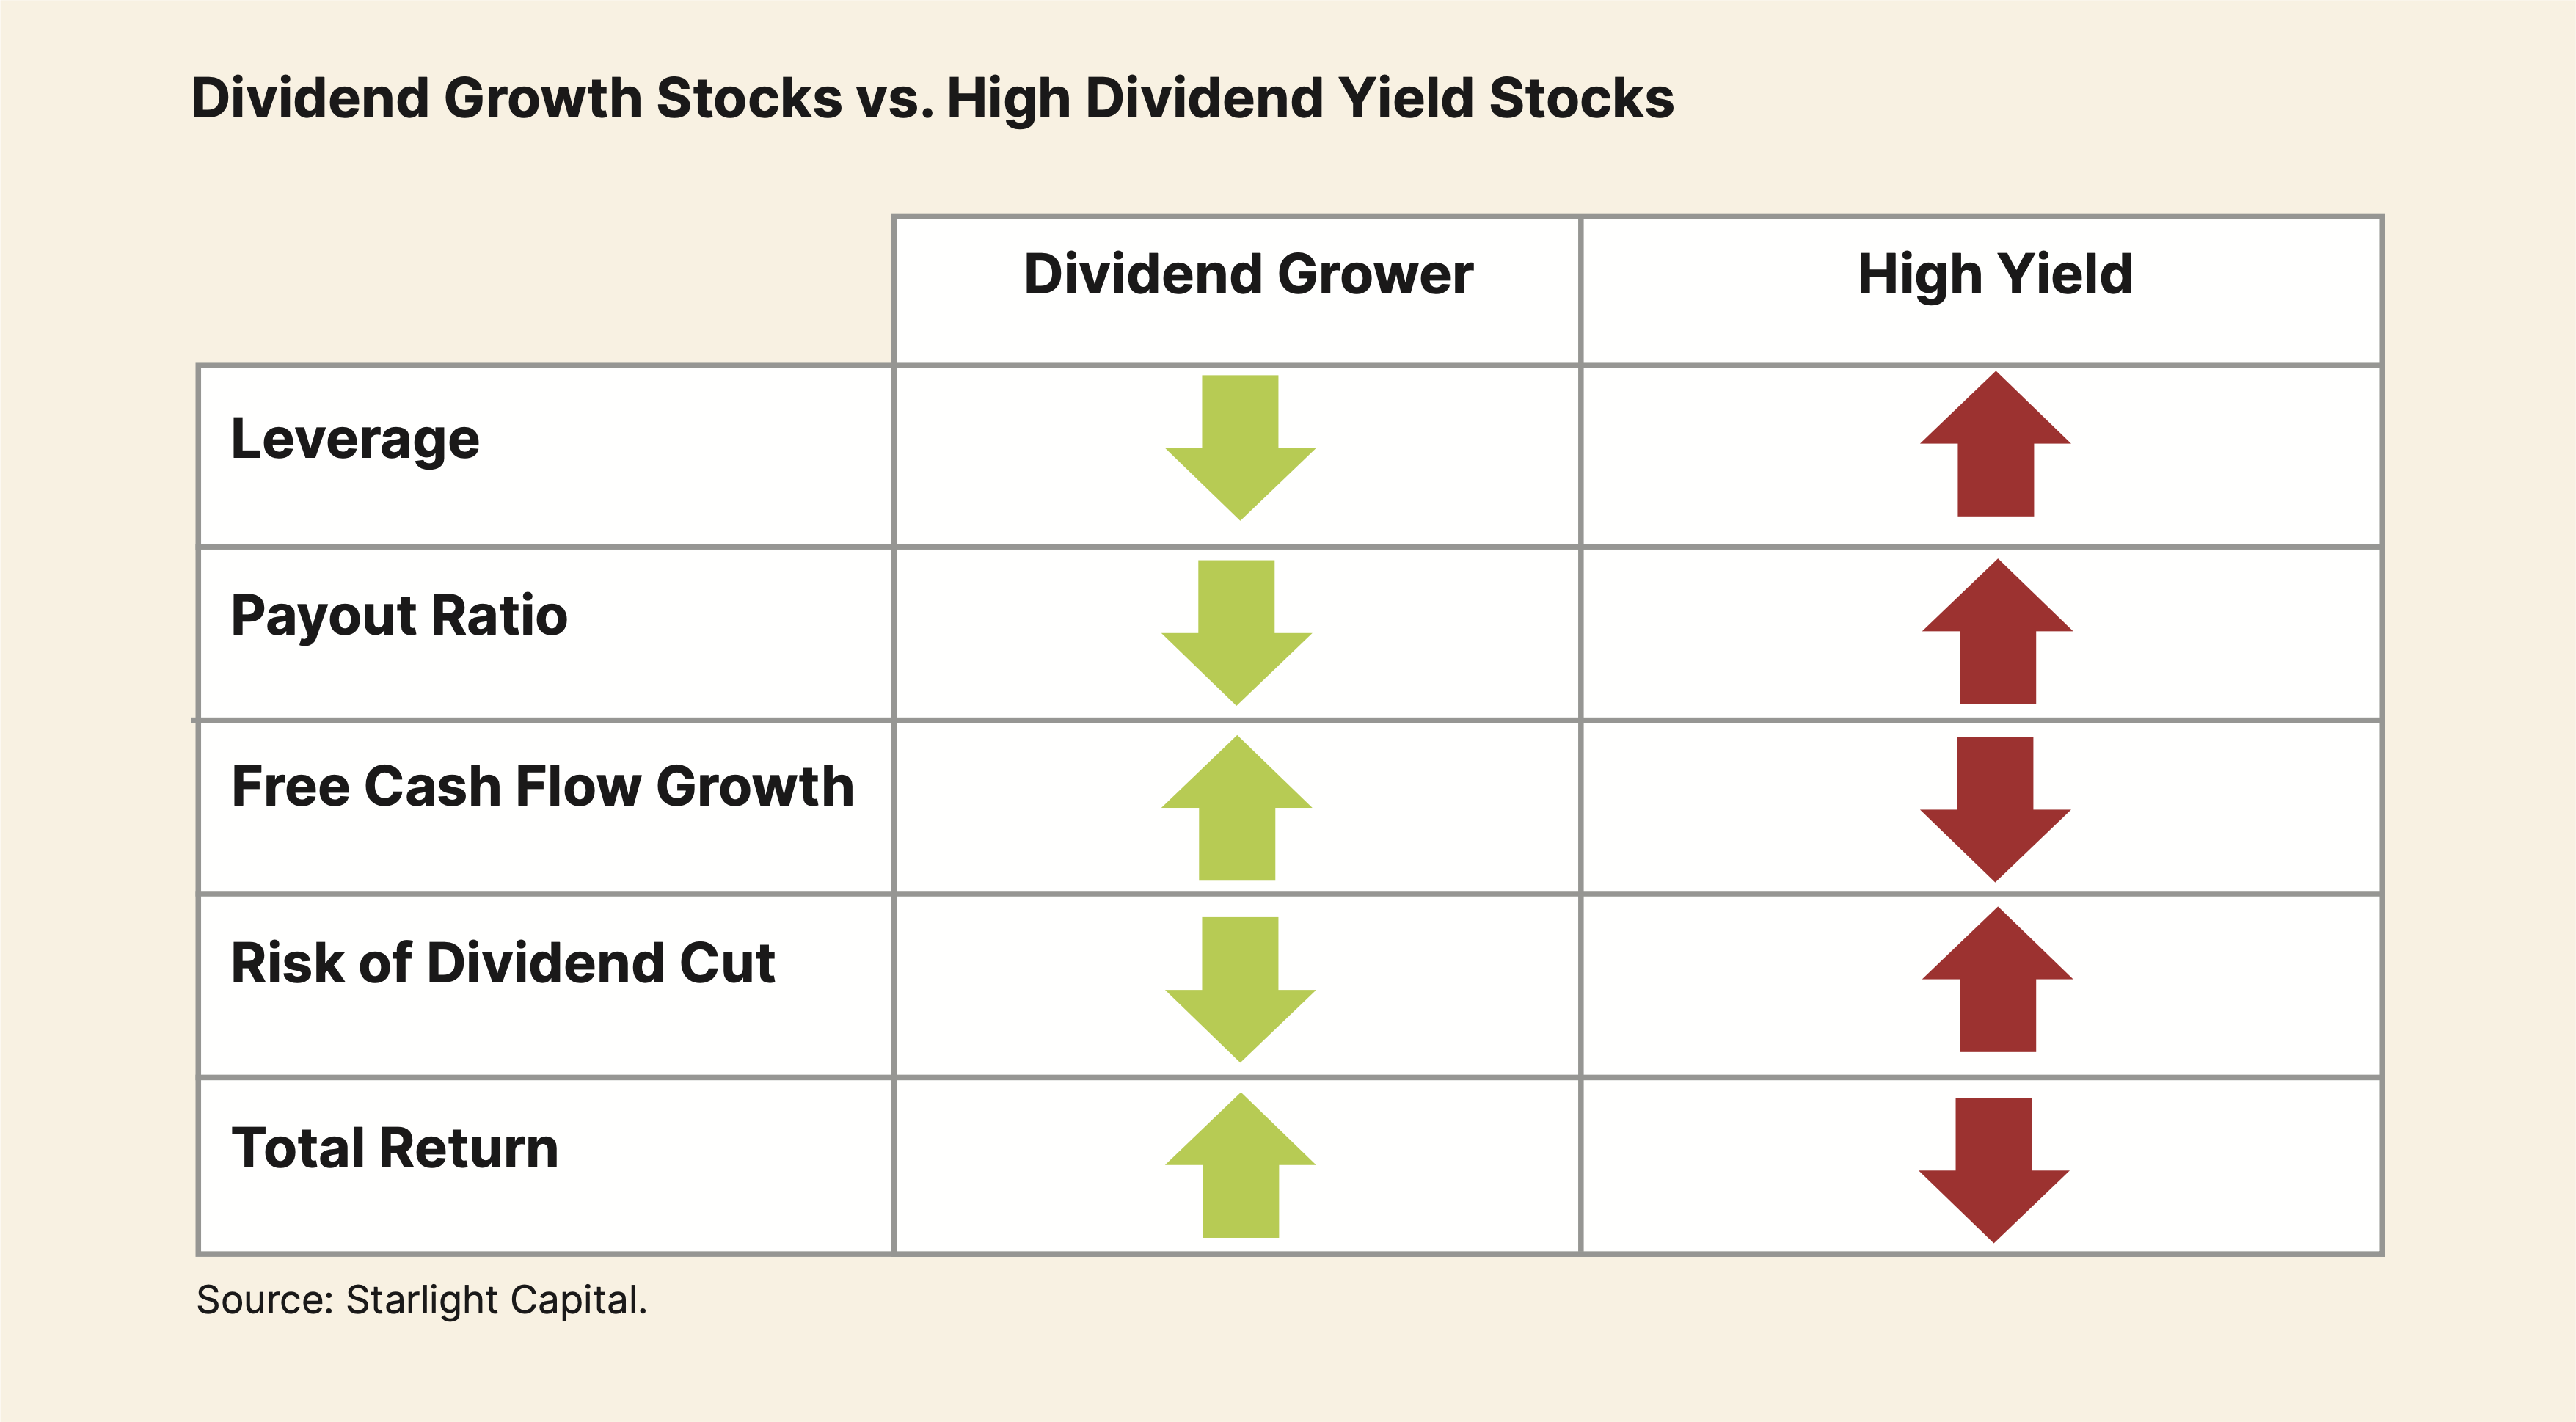
Dividend Growth Stocks vs. High Dividend Yield Stocks
Which is Better for Long-Term Performance?
Investors are generally familiar with the Dividend Yield of a stock. Mature businesses with recurring free cash flow typically pay out some of that cash flow as dividends. Historically, dividend-paying companies have been low growth businesses but their ability to generate strong recurring free cash flow and commitment to paying out consistent dividends, has allowed them to outperform the market.
Investors are generally less familiar with the concept of Yield on Cost (“YOC”). YOC looks at the Dividend Yield of a stock based on the original purchase price of the stock. For companies that pay static dividends, Dividend Yield and YOC may be the same. However, for companies that pay rising dividends (“Dividend Growth” companies), the YOC generally rises over time. Dividend Growth companies tend to have rising free cash flow that allows them to pay rising dividends over time.
Investors are generally less familiar with the concept of Yield on Cost (“YOC”). YOC looks at the Dividend Yield of a stock based on the original purchase price of the stock. For companies that pay static dividends, Dividend Yield and YOC may be the same. However, for companies that pay rising dividends (“Dividend Growth” companies), the YOC generally rises over time. Dividend Growth companies tend to have rising free cash flow that allows them to pay rising dividends over time.
Dividend Growth Has Produced Higher Returns Over Time
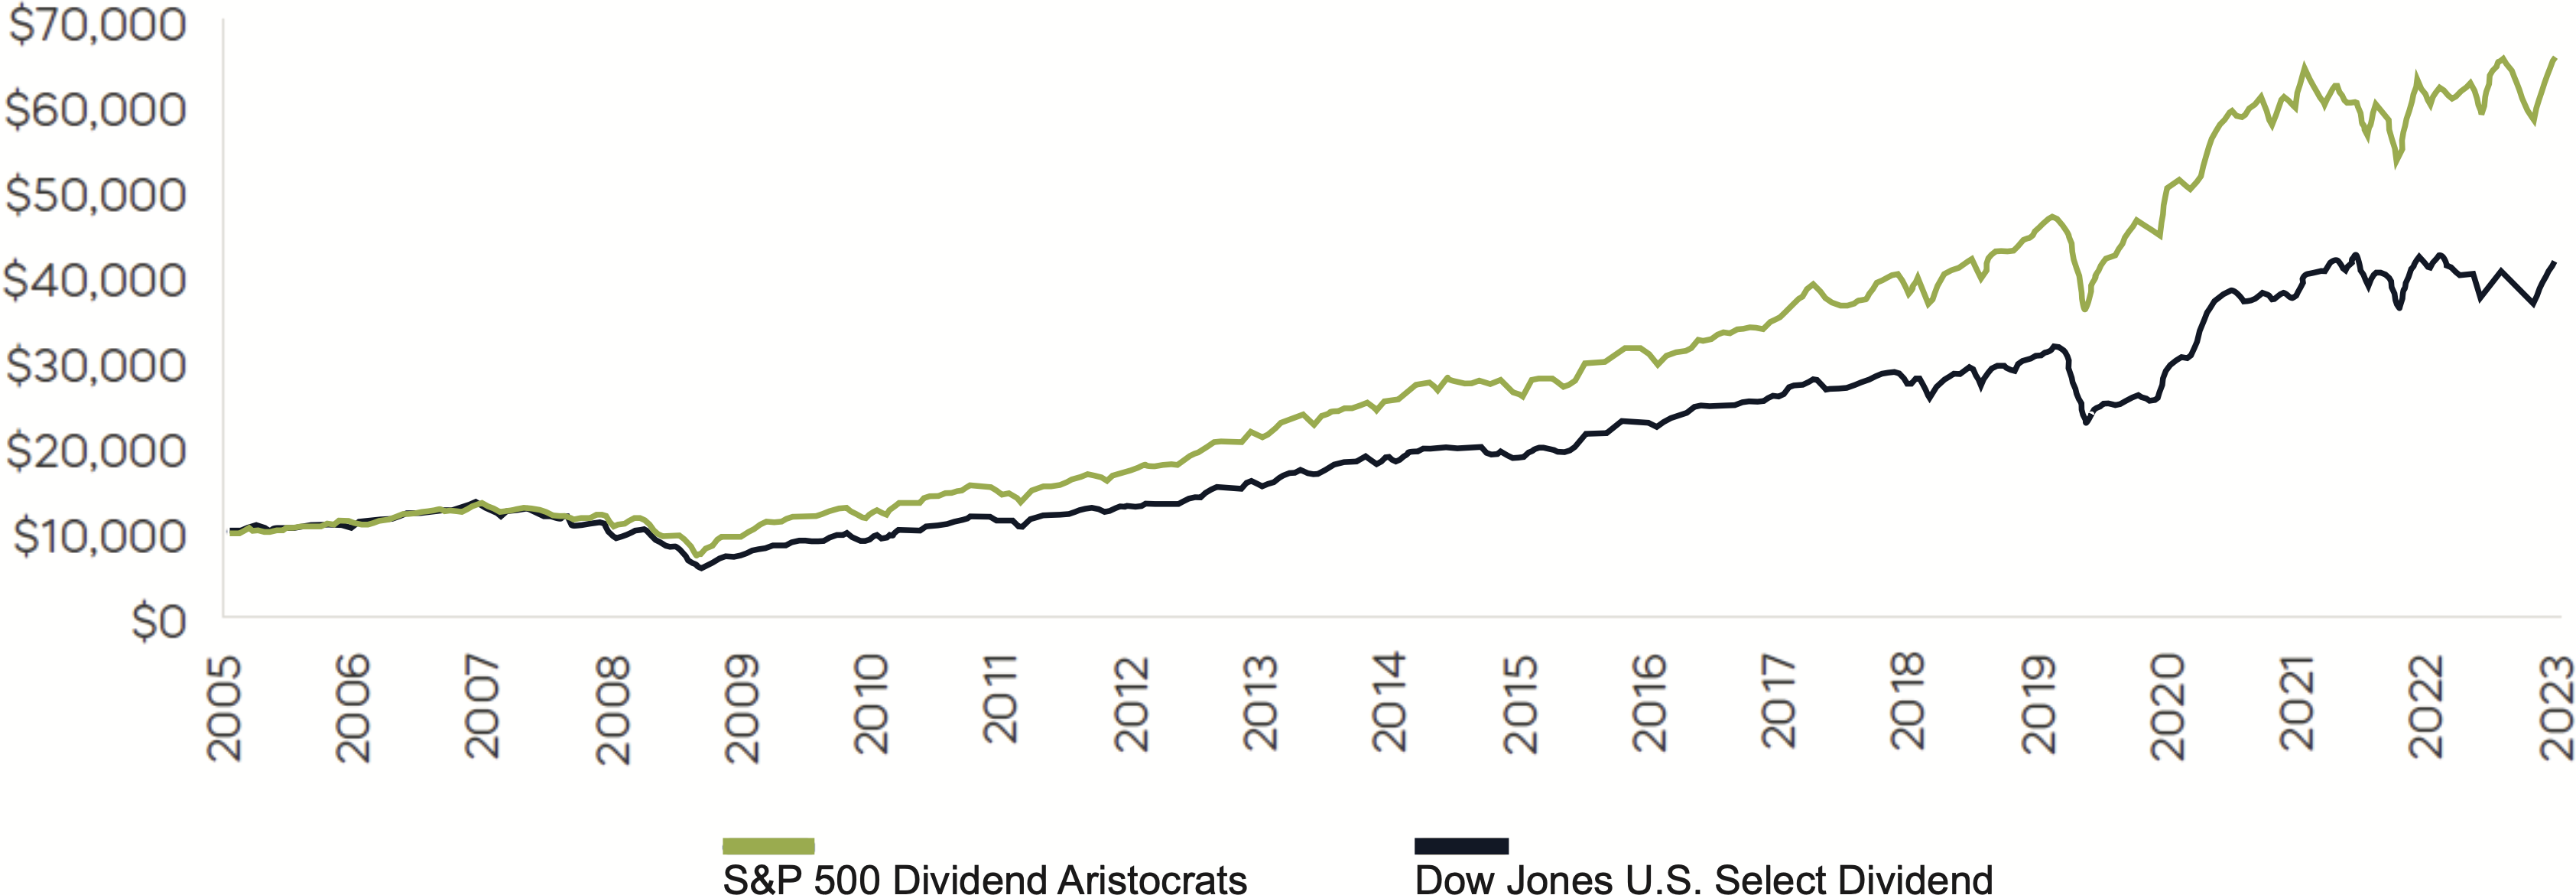
Source: Bloomberg Finance L.P. Data from 5/2/05-12/31/23. Dividend growth is represented by the S&P 500 Dividend Aristocrats Index, and high dividend yield is represented by the Dow Jones U.S. Select Dividend Index. Index returns are for illustrative purposes only and do not reflect any management fees, transaction costs or expenses. Indexes are unmanaged, and one cannot invest directly in an index. Past performance does not guarantee future results.
Investors often face a choice between Dividend Growth stocks and High Yield stocks when seeking income-generating investments. While High Yield stocks offer attractive immediate returns, Dividend Growth stocks provide superior long-term benefits, including income growth, capital appreciation, and lower volatility.
Dividend Yield is particularly valuable for investors seeking immediate income or comparing the income- generating potential of various stocks at a specific point in time. Using Verizon Communications Inc. ("Verizon") as an example of a high-yield stock and Visa Inc. ("Visa") as a dividend grower, we start our analysis from March 2008, which marks the earliest point of investment due to Visa’s IPO timing. At the outset, Visa had a modest dividend yield of 0.2%, significantly lower than Verizon’s initial yield of 5.6%. Over the course of 12 years, however, Visa’s steadily increasing dividend has compensated for its lower initial yield. By 2020, Visa’s YOC had surpassed that of Verizon. Additionally, by the end of 2023, Visa’s YOC had reached 12%, significantly higher than Verizon’s YOC of 7.8%.
Dividend Yield is particularly valuable for investors seeking immediate income or comparing the income- generating potential of various stocks at a specific point in time. Using Verizon Communications Inc. ("Verizon") as an example of a high-yield stock and Visa Inc. ("Visa") as a dividend grower, we start our analysis from March 2008, which marks the earliest point of investment due to Visa’s IPO timing. At the outset, Visa had a modest dividend yield of 0.2%, significantly lower than Verizon’s initial yield of 5.6%. Over the course of 12 years, however, Visa’s steadily increasing dividend has compensated for its lower initial yield. By 2020, Visa’s YOC had surpassed that of Verizon. Additionally, by the end of 2023, Visa’s YOC had reached 12%, significantly higher than Verizon’s YOC of 7.8%.
YoC: Dividend Grower vs. High Yield
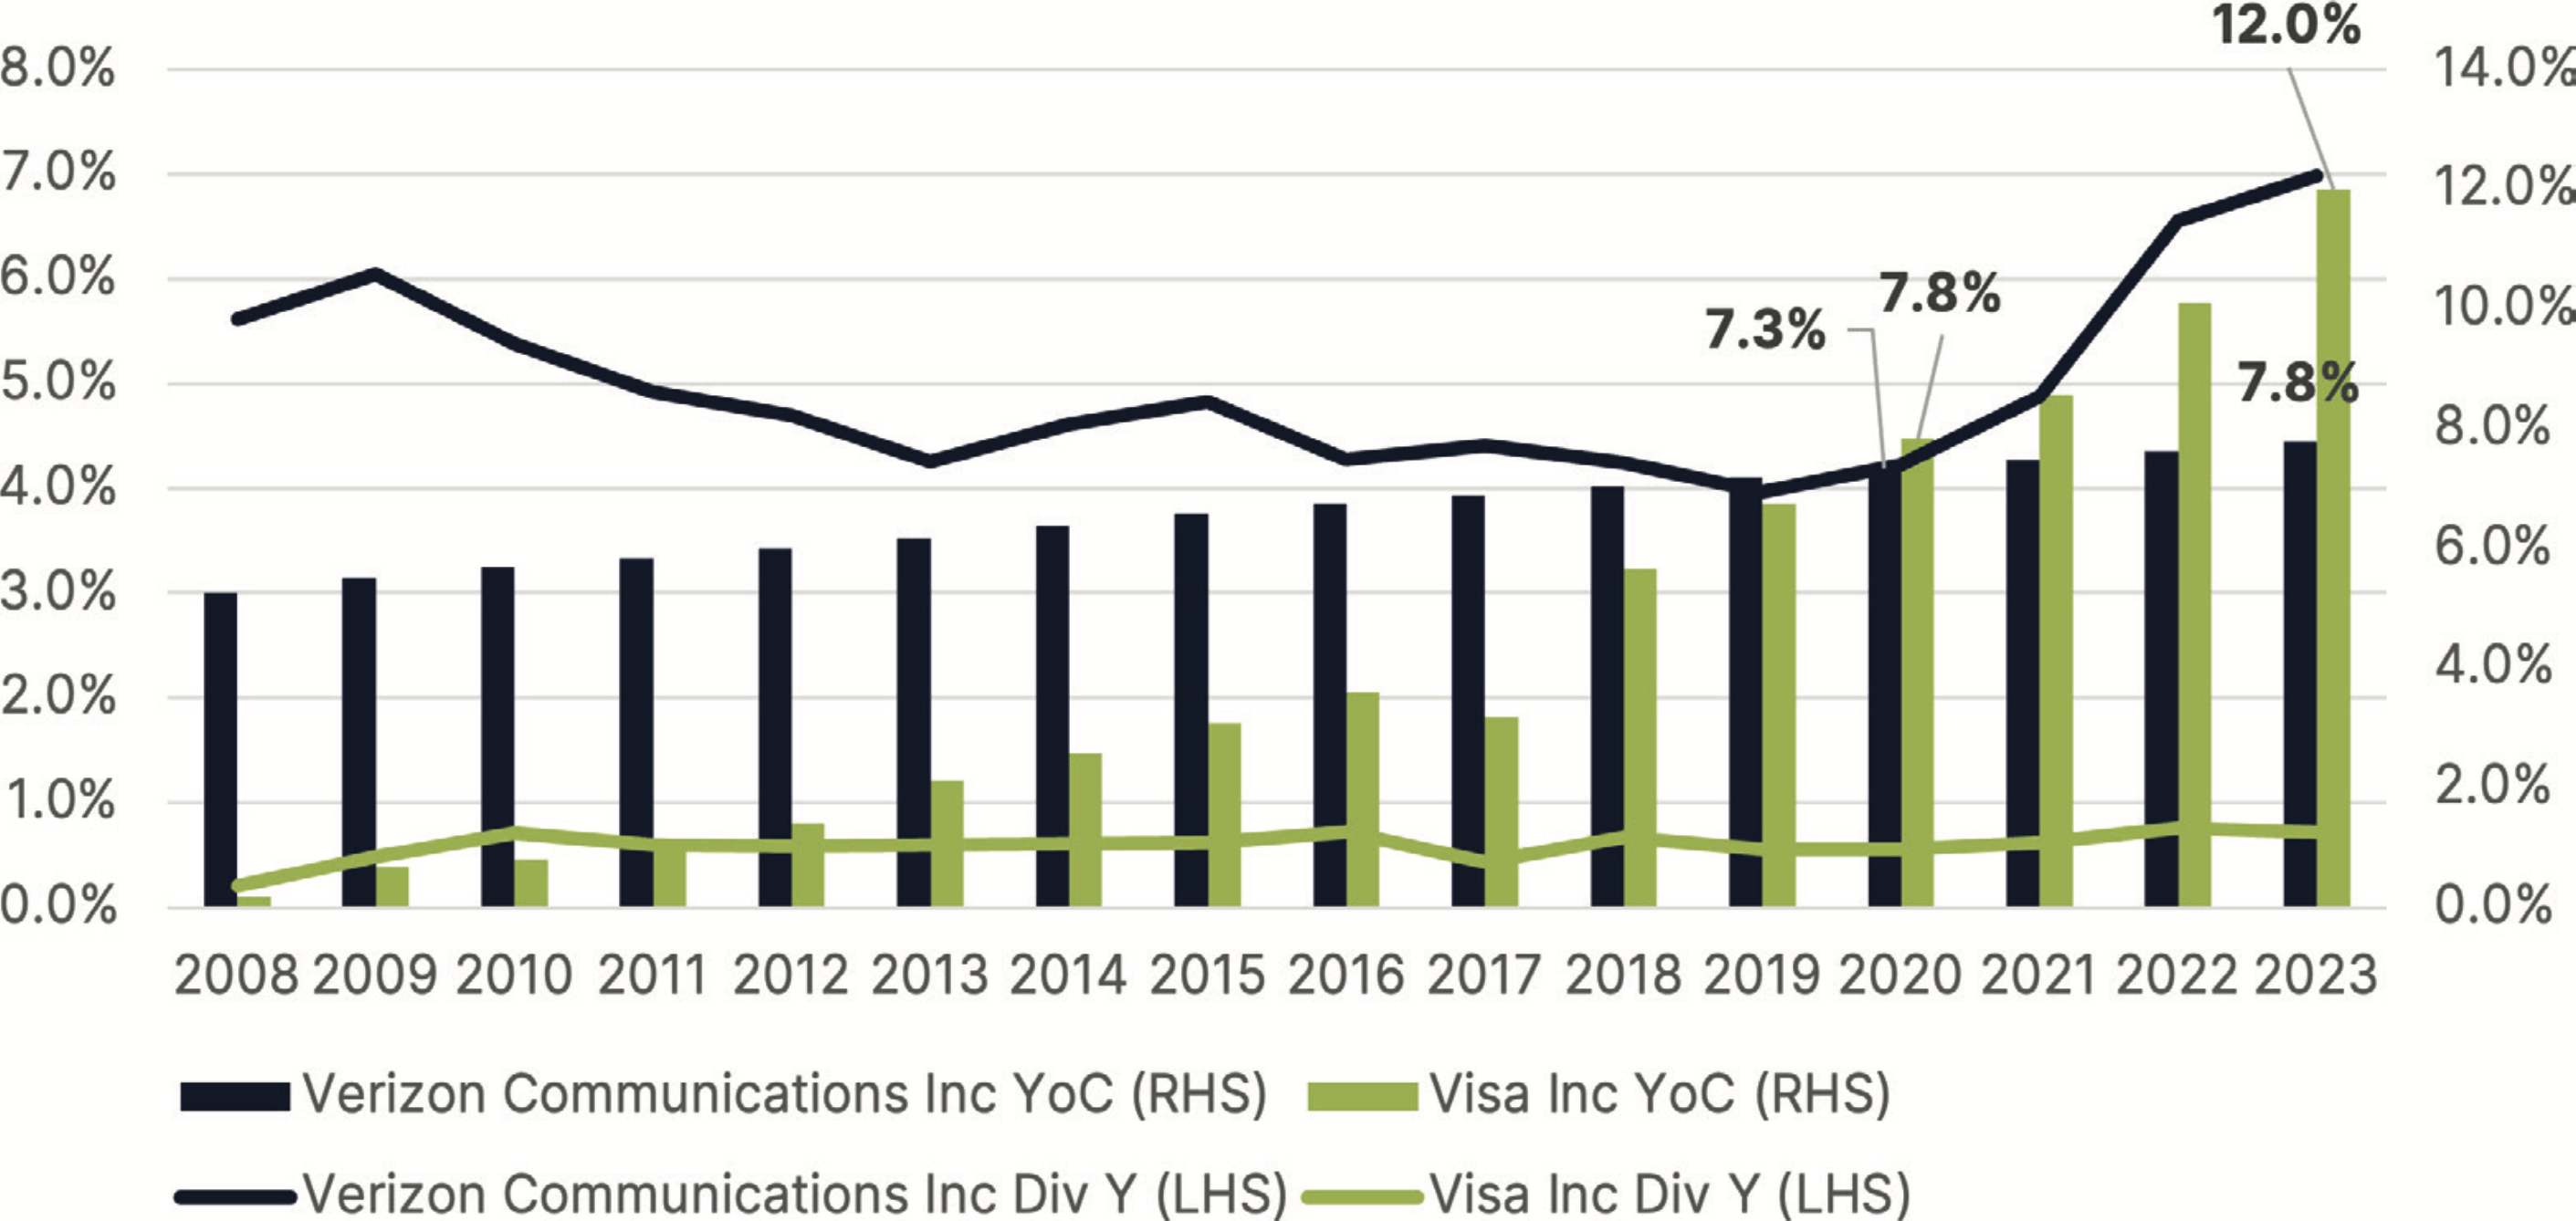
Source: Starlight Capital & Bloomberg Finance L.P.– 16-year period ending March 15th, 2024.
The Advantages of Dividend Growth Stocks
Dividend growth stocks are typically associated with companies that have a strong financial foundation and a history of profitability. The ability to consistently increase dividends is a testament to stable cash flows and effective management. Companies that commit to long term dividend growth must exhibit the willingness and ability to maintain that growth throughout a variety of economic environments. Without both, management may not have the level of commitment required to weather any economic storms and maintain consistent growth. Investors rely on this level of commitment in order to rely on the income growth to maintain their standard of living.
For example, Visa, which has steadily increased its dividend from $0.10 to $2.08 over the past 15 years (over 22.0% compound annual growth rate) demonstrates the benefits of investing in companies with consistent dividend growth. As dividends grow, investors can reinvest these funds to acquire additional shares, leading to significant growth in their investment over time. Additionally, dividend growth stocks offer a hedge against inflation, as growing dividend income helps maintain the purchasing power of the investment.
For example, Visa, which has steadily increased its dividend from $0.10 to $2.08 over the past 15 years (over 22.0% compound annual growth rate) demonstrates the benefits of investing in companies with consistent dividend growth. As dividends grow, investors can reinvest these funds to acquire additional shares, leading to significant growth in their investment over time. Additionally, dividend growth stocks offer a hedge against inflation, as growing dividend income helps maintain the purchasing power of the investment.
Comparing Dividend Growth Stocks and High Yield Stocks
High Yield stocks are often the function of a declining stock price or financial engineering, both of which often lead to higher volatility and risk. When comparing the risk profile of a high yielding stock vs. a dividend growing stock, one must consider payout ratios and debt levels. High yield stocks typically payout a high portion of their free cash flow towards dividends, leading to a high payout ratio. High yield stocks may also have funded their dividends with debt issuance, leading to higher leverage ratios and risk. Both factors could lead to a dividend cut during times of stress, reducing an investor’s income, and potentially exposing them to large declines in stock price.
Dividend growth stocks tend to be more stable and offer better risk-adjusted returns. Their current yields are generally lower but with strong growth potential over time. It is this dividend growth that leads to a higher Yield on Cost. Dividend Growth stocks exhibit lower risk due to their lower payout ratios and generally come with strong balance sheets and low leverage. This allows them the flexibility to raise their dividends even during difficult times. The consistent growth in dividends also provides an increasing stream of income over time, which is crucial for maintaining lifestyle and covering expenses, especially in retirement.
Dividend growth stocks tend to be more stable and offer better risk-adjusted returns. Their current yields are generally lower but with strong growth potential over time. It is this dividend growth that leads to a higher Yield on Cost. Dividend Growth stocks exhibit lower risk due to their lower payout ratios and generally come with strong balance sheets and low leverage. This allows them the flexibility to raise their dividends even during difficult times. The consistent growth in dividends also provides an increasing stream of income over time, which is crucial for maintaining lifestyle and covering expenses, especially in retirement.
Dividend Growth Stocks vs. High Dividend Yield Stocks
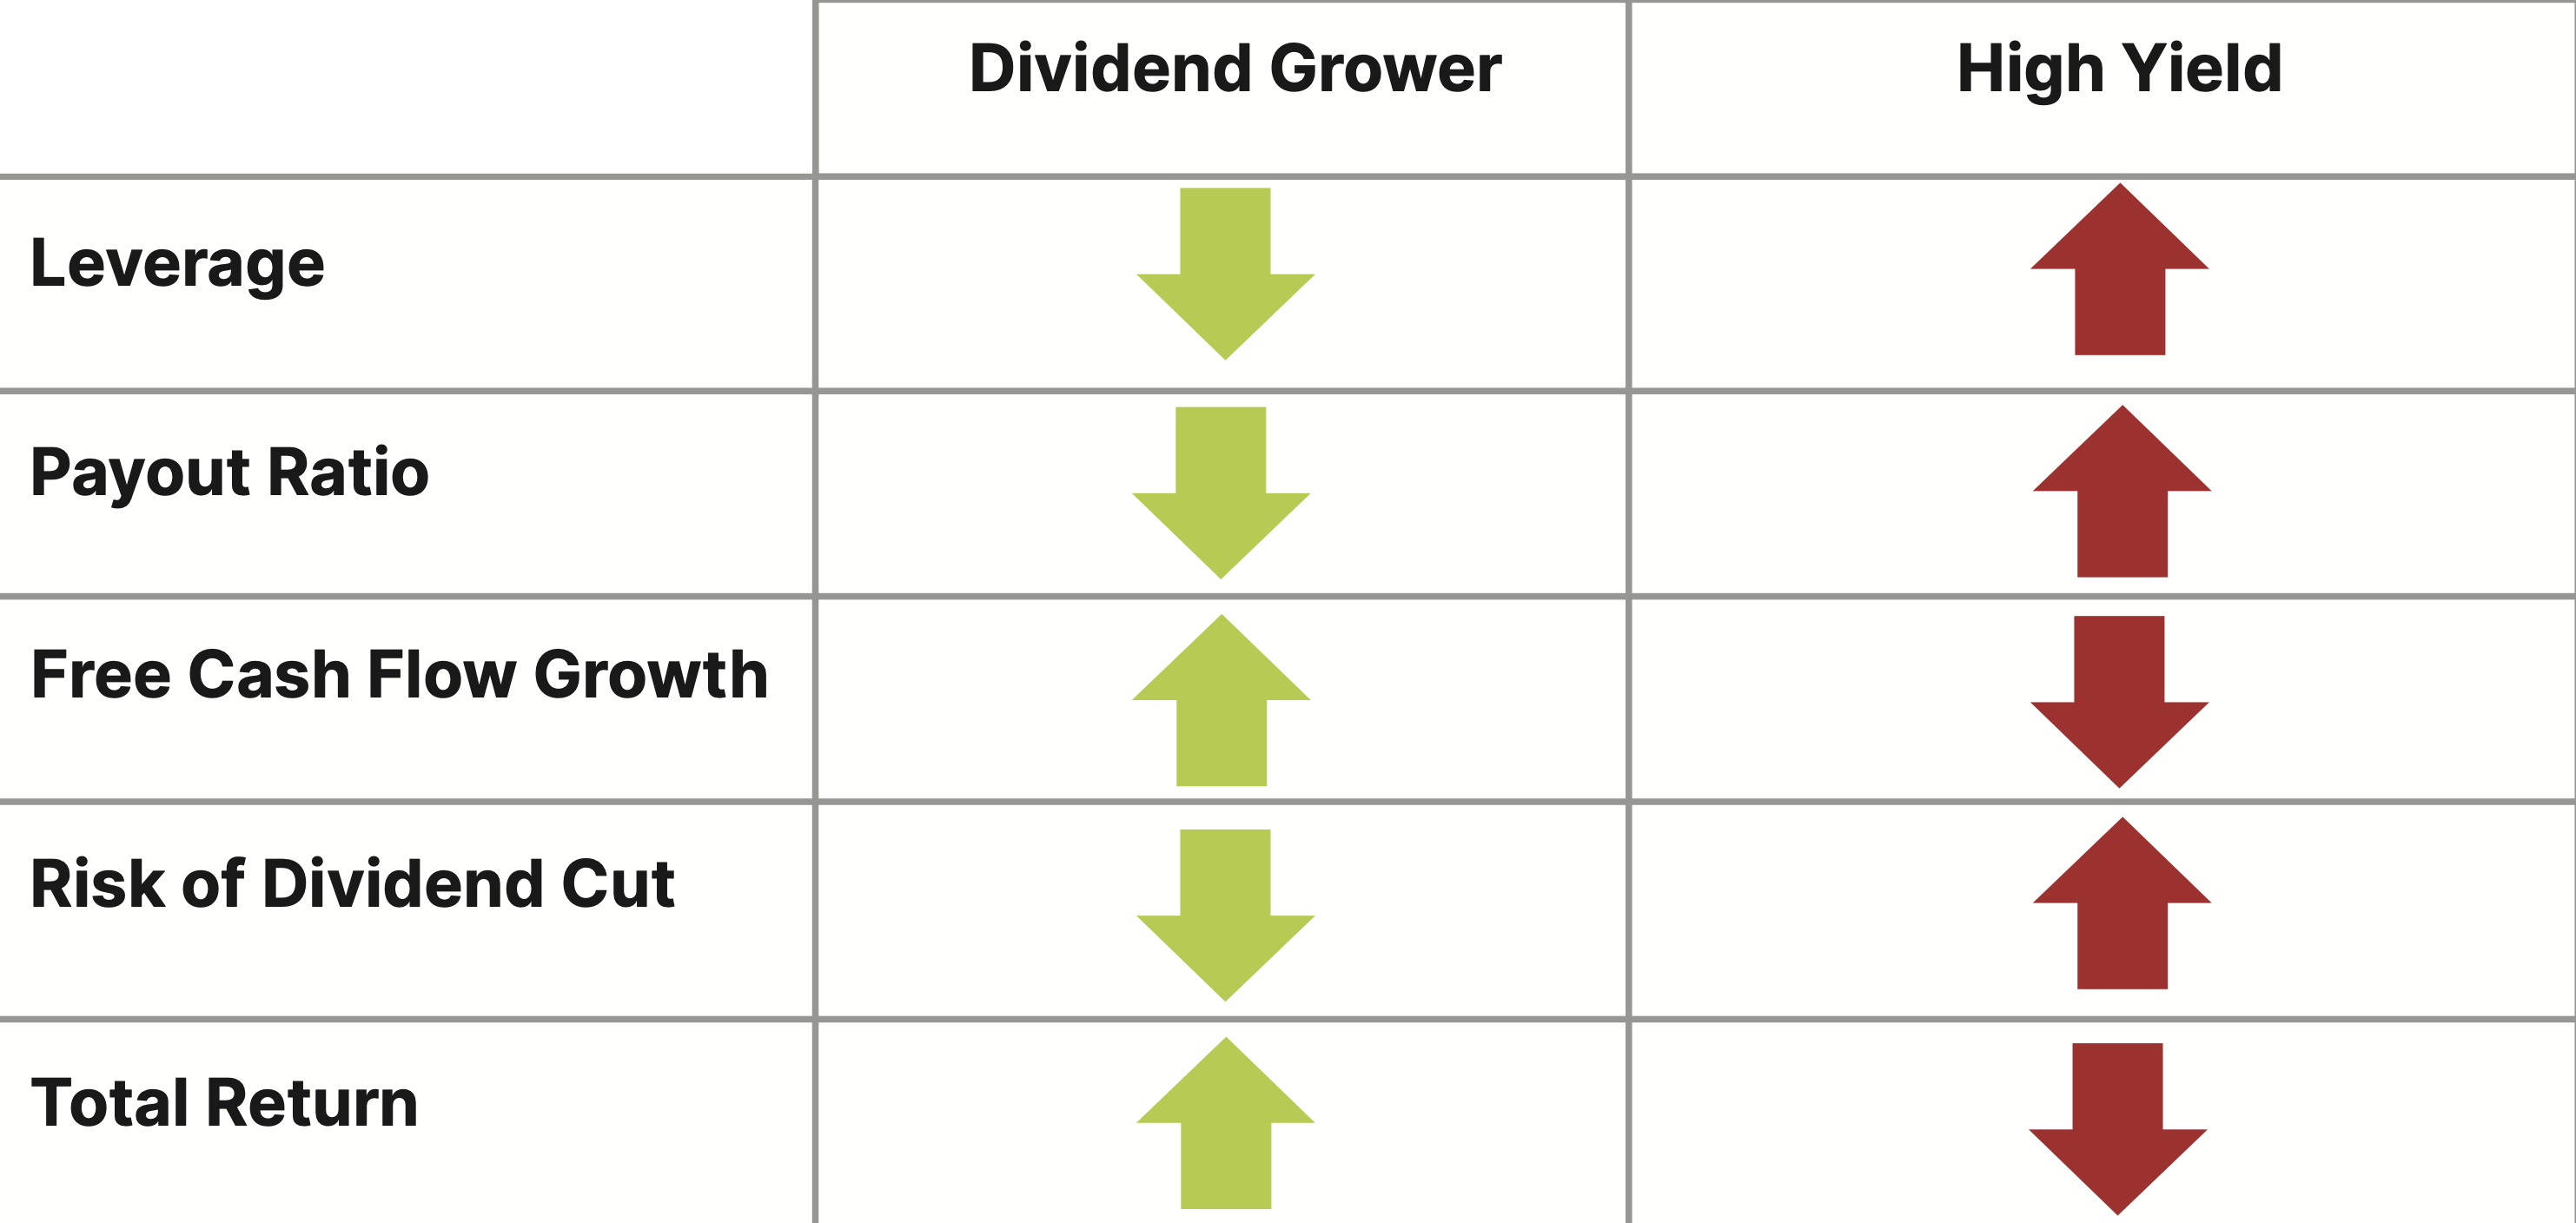
Source: Starlight Capital.
To further illustrate the impact of consistent dividend growth, let’s consider some real-world stock examples:
We selected four companies for our analysis—two from the US and two from Canada—assuming a 16-year holding period that concludes on Friday, March 15, 2024. It was further assumed that no additional shares were purchased after the initial investment on March 15, 2008. Consequently, the cost basis is equal to the price at the start of the holding period.
We selected four companies for our analysis—two from the US and two from Canada—assuming a 16-year holding period that concludes on Friday, March 15, 2024. It was further assumed that no additional shares were purchased after the initial investment on March 15, 2008. Consequently, the cost basis is equal to the price at the start of the holding period.
United States
High Dividend Grower vs. High Yield - United States - 16 Year Period
High Dividend Grower vs. High Yield - United States - 16 Year Period
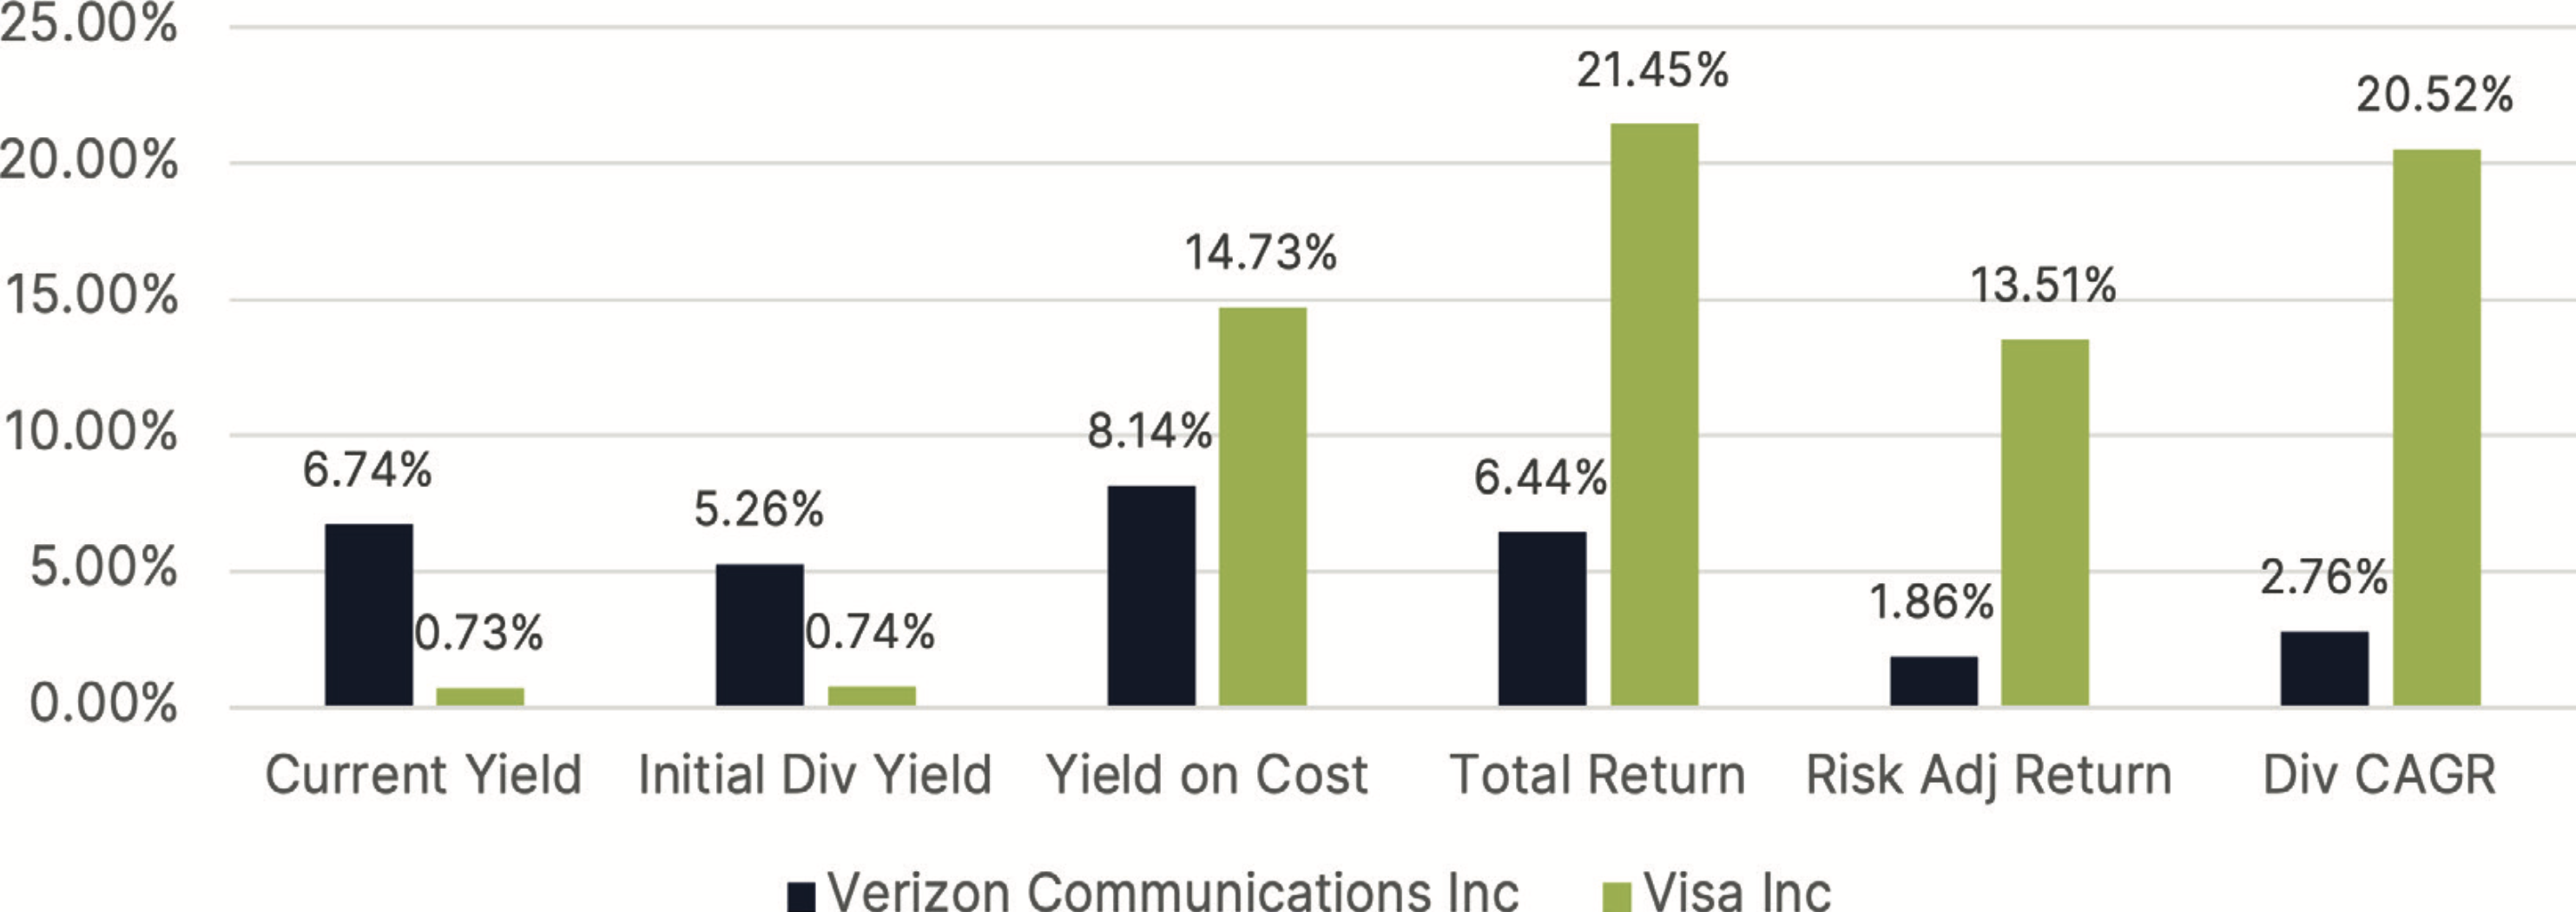
Source: Starlight Capital, Bloomberg Finance L.P. & Morningstar Direct – 16-year period ending March 15th, 2024.
Looking at the initial yield, Verizon would seem to be the superior choice, however the higher dividend growth of Visa over the period (21% vs. 3%) has more than made up for the lower initial yield. In addition, Visa has outperformed Verizon by over 15% in total return and over 11% in risk adjusted return during the holding period.
On March 15th, 2024, Visa’s Dividend yield was 0.73% vs. 6.74% for Verizon. below shows that small/mid cap dividend growers likely owe this outperformance to their ability to generate higher returns on equity and earnings per share growth.
On March 15th, 2024, Visa’s Dividend yield was 0.73% vs. 6.74% for Verizon. below shows that small/mid cap dividend growers likely owe this outperformance to their ability to generate higher returns on equity and earnings per share growth.
Canada
High Dividend Grower vs. High Yield - Canada - 16 Year Period
High Dividend Grower vs. High Yield - Canada - 16 Year Period
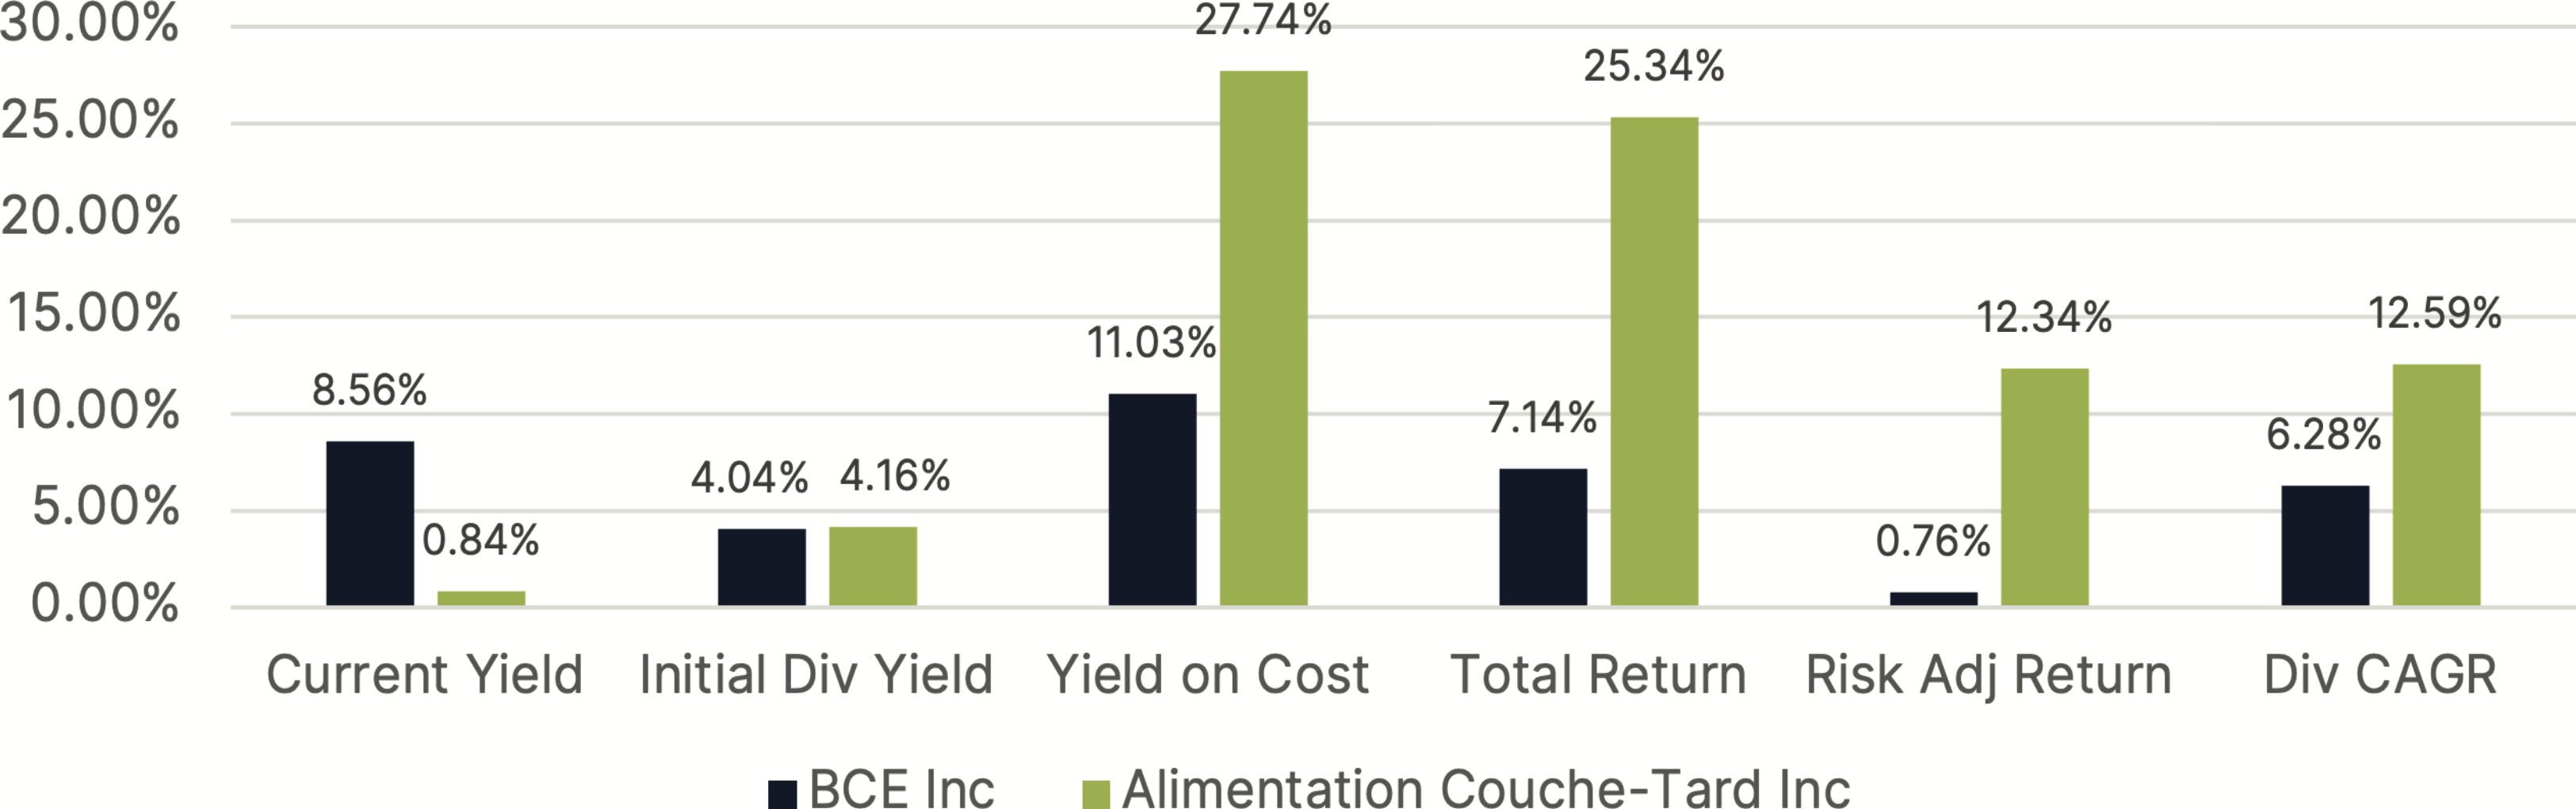
Source: Starlight Capital, Bloomberg Finance L.P. & Morningstar Direct – 16-year period ending March 15th, 2024
This trend is not exclusive to the US; similar patterns emerge from the Canadian market. For example, the lower-yield investment, Alimentation Couche-Tard, not only compensated for its lower initial yield but also outperformed BCE. Over the holding period, Couche-Tard exceeded BCE by more than 18% in total return and over 11% in risk-adjusted return.
Dividend Growth is the Winning Strategy
While Dividend Yield provides a useful snapshot of a stock’s immediate income potential, Yield on Cost offers a deeper understanding of the long-term growth in income. Dividend Growth stocks offer a more compelling investment proposition for long-term investors, providing a combination of rising income and capital appreciation, with lower risk. Investors should, therefore, prioritize companies with a strong track record of dividend growth to maximize their total return over time.
Starlight Dividend Growth Class is a concentrated portfolio of 43 high-quality companies with a track record of increasing their distributions annually. In 2023 the portfolio generated 40 dividend increases with an average increase of 11.64%. Series F targets a 4% yield on an annual basis (paid monthly).
We invite you to partner with us.
Starlight Capital
Access dividend growth with Starlight Capital
Starlight Capital is an independent Canadian asset management firm with over $1 billion in assets under management. We manage Global and North American diversified private and public equity investments across traditional and alternative asset classes, including real estate, infrastructure and private equity. Our goal is to deliver superior risk-adjusted, total returns to investors through a disciplined investment approach: Focused Business Investing.
Focused Business Investing means we invest in great businesses when they offer us enough return for the risk we are exposed to. Great businesses are characterized by strong recurring cash flow, irreplaceable assets, low leverage, and strong management team. The result is concentrated portfolios of great businesses that reward investors with rising dividends.
The Starlight Dividend Growth Class is an opportunity to invest in high-quality dividend growing companies in North America.
Diversified Equities
Starlight Dividend Growth Class
Inception—2003
Investment Objective:
To achieve above average long-term capital growth that is consistent with a conservative investment philosophy encompassing a diversified portfolio approach. The Fund invests primarily in equity securities of Canadian companies that demonstrate financial strength and good growth potential.
Fund Codes
Series A (SLC515)
Series F (SLC517)
Series FT6 (SLC5176)
Series FT8 (SLC5178)
Series T8 (SLC5158)
Series PTF (SCDGC)
Distribution Frequency
Monthly
Important disclaimer.
The views in this update are subject to change at any time based upon market or other conditions and are current as of April 16, 2024. While all material is deemed to be reliable, accuracy and completeness cannot be guaranteed.
Certain statements in this document are forward-looking. Forward-looking statements (“FLS”) are statements that are predictive in nature, depend upon or refer to future events or conditions, or that include words such as “may,” “will,” “should,” “could,” “expect,” “anticipate,” “intend,” “plan,” “believe,” or “estimate,” or other similar expressions. Statements that look forward in time or include anything other than historical information are subject to risks and uncertainties, and actual results, actions or events could differ materially from those set forth in the FLS. FLS are not guarantees of future performance and are by their nature based on numerous assumptions. Although the FLS contained herein are based upon what Starlight Capital and the portfolio manager believe to be reasonable assumptions, neither Starlight Capital nor the portfolio manager can assure that actual results will be consistent with these FLS. The reader is cautioned to consider the FLS carefully and not to place undue reliance on FLS. Unless required by applicable law, it is not undertaken, and specifically disclaimed that there is any intention or obligation to update or revise FLS, whether as a result of new information, future events or otherwise. Investment funds are not guaranteed, their values change frequently, and past performance may not be repeated.
The content of this document (including facts, views, opinions, recommendations, descriptions of or references to, products or securities) is not to be used or construed as investment advice, as an offer to sell or the solicitation of an offer to buy, or an endorsement, recommendation or sponsorship of any entity or security cited. Although we endeavour to ensure its accuracy and completeness, we assume no responsibility for any reliance upon it. Commissions, trailing commissions, management fees and expenses all may be associated with investment funds. Please read the offering documents before investing. Investors should consult with their advisors prior to investing.
Starlight, Starlight Investments, Starlight Capital and all other related Starlight logos are trademarks of Starlight Group Property Holdings Inc.