The Case for Global Real Estate
Publicly traded real estate can be found in two basic forms owner / operators and developers. The major difference between the two is the manner in which they generate their earnings. Owner / operators generate the majority of their earnings from rental income derived from tenants occupying the real estate they own. This revenue and cash flow stream is usually driven by multi-year leases providing a high level of visibility and predictability. In contrast, developers generate the majority of their earnings from the sale of the real estate they have developed. This revenue and cash flow stream is considerably more volatile with less visibility and predictability.
Countries that have adopted the REIT approach
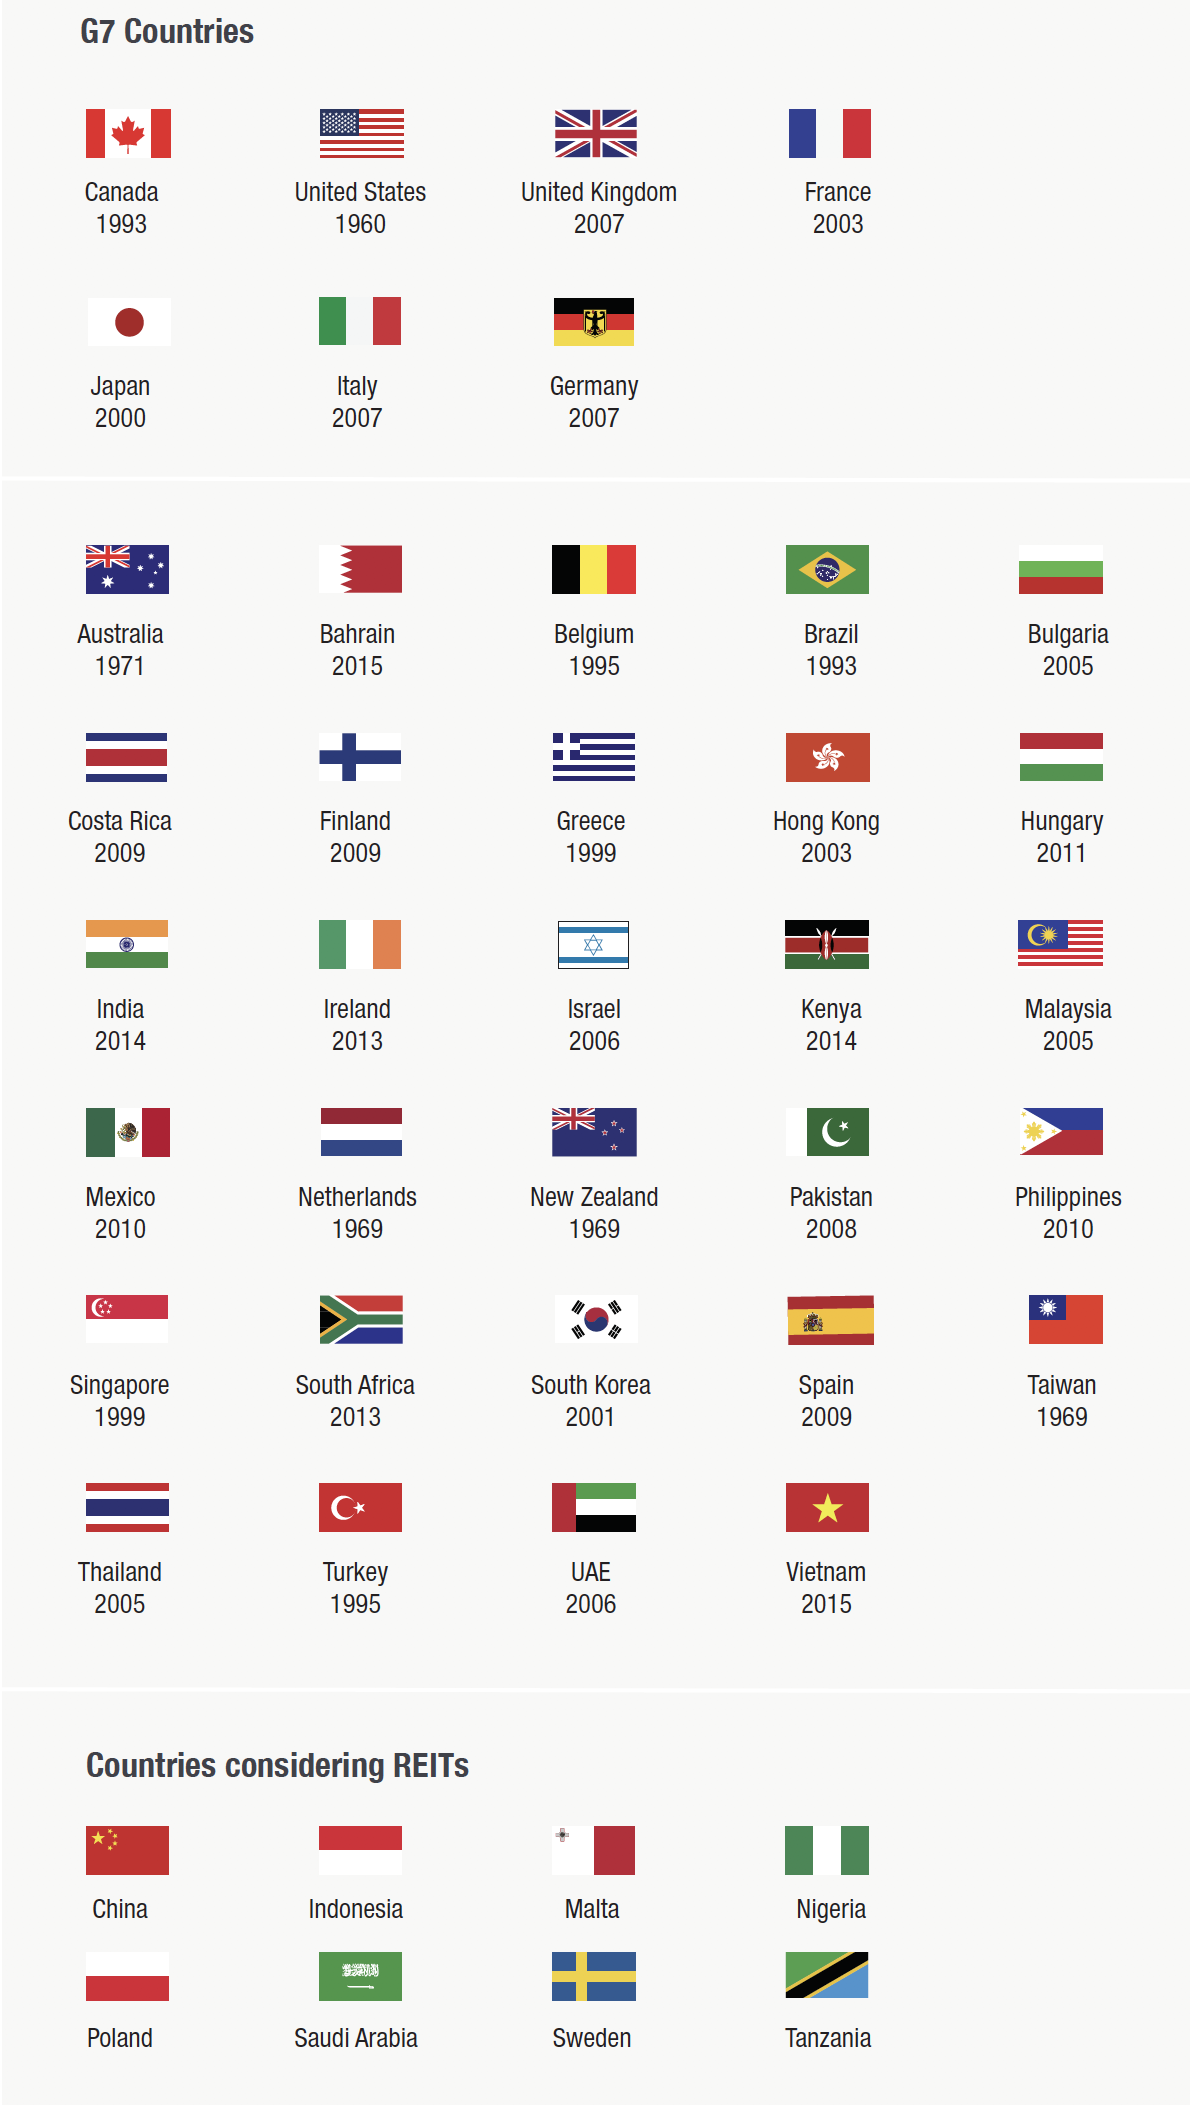
Source: NAREIT® Date indicates adoption year of REIT rules
The majority of global publicly-traded real estate is in the owner / operator model with most structured as Real Estate Investment Trusts (“REITs”). Globally there are 35+ countries that have passed REIT-like legislation, with the period since 1994 recognized as the “modern REIT era”, from which better data is available.
In most countries in order to qualify as a REIT, a company must first meet two tests. First, the majority of the firm’s assets must be real estate (definitions and thresholds vary by country). Second, the firm must distribute most if not all of their earnings each year to investors. In some countries meeting the distribution test allows the REIT to avoid corporate income tax and distributions are paid out of pre-tax income.
In most countries in order to qualify as a REIT, a company must first meet two tests. First, the majority of the firm’s assets must be real estate (definitions and thresholds vary by country). Second, the firm must distribute most if not all of their earnings each year to investors. In some countries meeting the distribution test allows the REIT to avoid corporate income tax and distributions are paid out of pre-tax income.
Additional Information
Tax Illustration
| Corporation | REIT | |
|---|---|---|
| Revenue | $100.0 | $100.0 |
| Expenses | $70.0 | $70.0 |
| Pretax Income | $30.0 | $30.0 |
| Tax | $8.4 | — |
| Net Income | $21.6 | $30.0 |
| Distributions | $11.9 | $30.0 |
| Tax | $4.6 | $7.5 |
| Tax rate** | 39.3% | 24.6% |
| Net Cash Distribution | $7.2 | $22.5 |
Notes: 2018 S&P/TSX Composite Index payout ratio was 59% of net income. S&P/TSX Capped REIT Index 2018 distributions were classified as 30.8% Other Income, 8.6% Foreign Income, 11.8% Capital Gains, 48.0% Return of Capital and 0.9% Dividends. *Ontario corporation tax rate of 26.5% as of January 2020. **The average tax rate for 2018 of these distributions was approximately 24.6%. Based on Ontario top marginal tax rate as of January 2020.
Sources: E&Y Tax Calculators, company reports, Starlight Capital, Bloomberg LP.
Sources: E&Y Tax Calculators, company reports, Starlight Capital, Bloomberg LP.
In addition, some REIT distributions have material amounts of “return of capital” which is generally exempt from taxation at the time of receipt by the investor. This results in even greater after-tax yields to REIT investors versus other competing investments.
The outperformance of REITs over this time period is often linked to declining interest rates. However, it’s important to note that global equities outperformed global bonds during this time period. Global equities were also levered to falling interest rates and certainly to rising economic output. The outperformance of REITs during this time period is a function of their structure and the unique attributes of REITs.
The outperformance of REITs over this time period is often linked to declining interest rates. However, it’s important to note that global equities outperformed global bonds during this time period. Global equities were also levered to falling interest rates and certainly to rising economic output. The outperformance of REITs during this time period is a function of their structure and the unique attributes of REITs.
After-tax yield comparison
| High Yield Bonds | Common Equity | Preferred Equity | REITs | |
|---|---|---|---|---|
| Yield | 5.88% | 2.82% | 3.87% | 5.62% |
| Tax Rate | 53.53% | 39.34% | 39.34% | 24.64% |
| A-T Yield | 2.73% | 1.71% | 2.35% | 4.24% |
| Inflation | 1.50% | 1.50% | 1.50% | 1.50% |
| A-T Real Yield | 1.23% | 0.21% | 0.85% | 2.74% |
Source: Bloomberg, TaxTips, Company Reports
Notes: High yield bonds represented by the Horizons Active High Yield Bond ETF, Common equity represented by the S&P/TSX Composite Index, Preferred equity represented by BMO Laddered Preferred Share Index ETF, REITs represented by the S&P/TSX Capped REIT Index. As of January 27, 2020. REITs distribution breakdown as for 2018 represented by the S&P/TSX Capped REIT Index.
*Based on Ontario top marginal tax rate as of January 2020.
REITs outperform other major asset
December 31, 2002 - December 31, 2019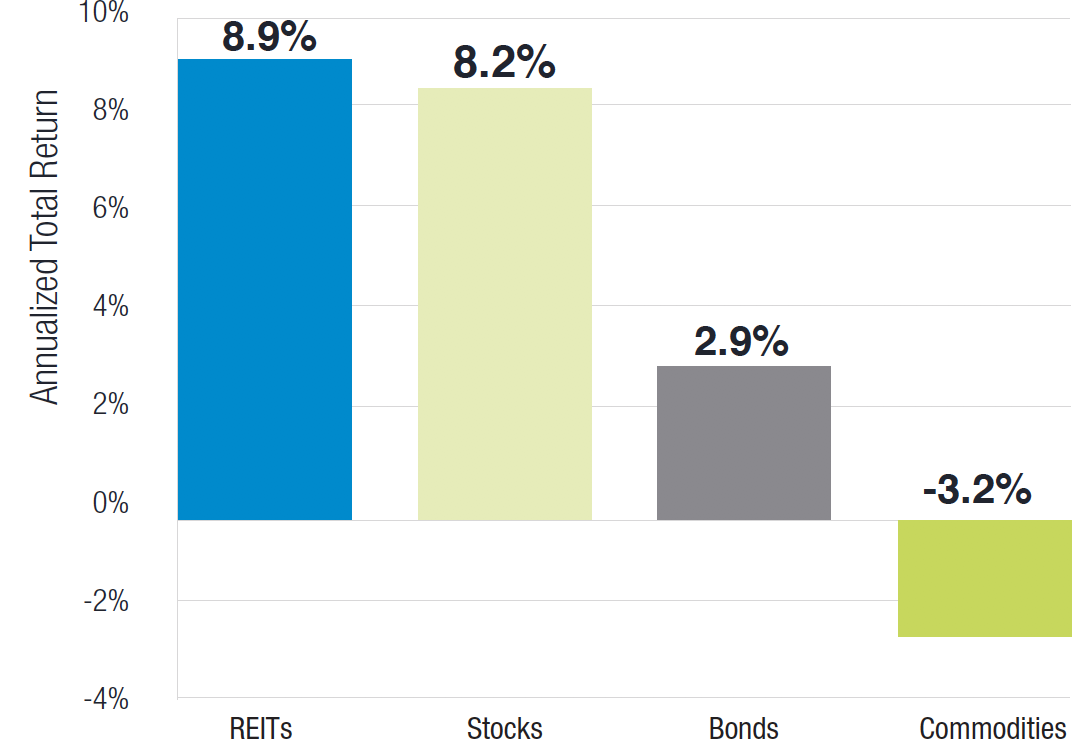
Source: Bloomberg Financial L.P. and Starlight Capital. Data from December 31, 2002 to December 31, 2019. REITs, Stocks, Bonds, and Commodities are represented by the FTSE EPRA/NAREIT Developed Total Return Index (CAD), MSCI World Index (CAD) and FTSE World Broad Investment-Grade Bond Index (WorldBIG) (CAD) and S&P GSCI Official Close Index TR, respectively. Past performance is no guarantee of future results. Chart is provided for illustrative purposes and reflects hypothetical historical performance.
REIT cash flows are leveraged to rising economic activity in several ways. As economic activity picks up, the demand for real estate increases as firms hire more employees and expand their facilities. This increase in occupancy and demand usually results in rising rents for REITs, particularly those with desirable real estate (locations, quality, etc.). Many REITs structure their leases to participate in rising inflation by way of periodic rent increases tied to inflation. As economic output rises, and inflation rises, REIT rents have the potential to escalate as well. Finally, as the demand for real estate increases, prime locations and properties receive a disproportionate amount of demand for incremental space. If the supply of real estate is constrained in some manner (islands, downtown, zoning) the cash flow growth of quality assets located in these supply-constrained areas can be very robust.
Because of the structure of REITs (mandatory high payout ratios), the total returns from REITs have a significant income component. Historically the total returns from REITs have been evenly split between capital appreciation and distributions. However, the distribution yield from REITs has historically been almost twice the dividend yield from common equity.
Because of the structure of REITs (mandatory high payout ratios), the total returns from REITs have a significant income component. Historically the total returns from REITs have been evenly split between capital appreciation and distributions. However, the distribution yield from REITs has historically been almost twice the dividend yield from common equity.
Contribution of reinvested dividends to total return
December 29, 1989 - July 31, 2018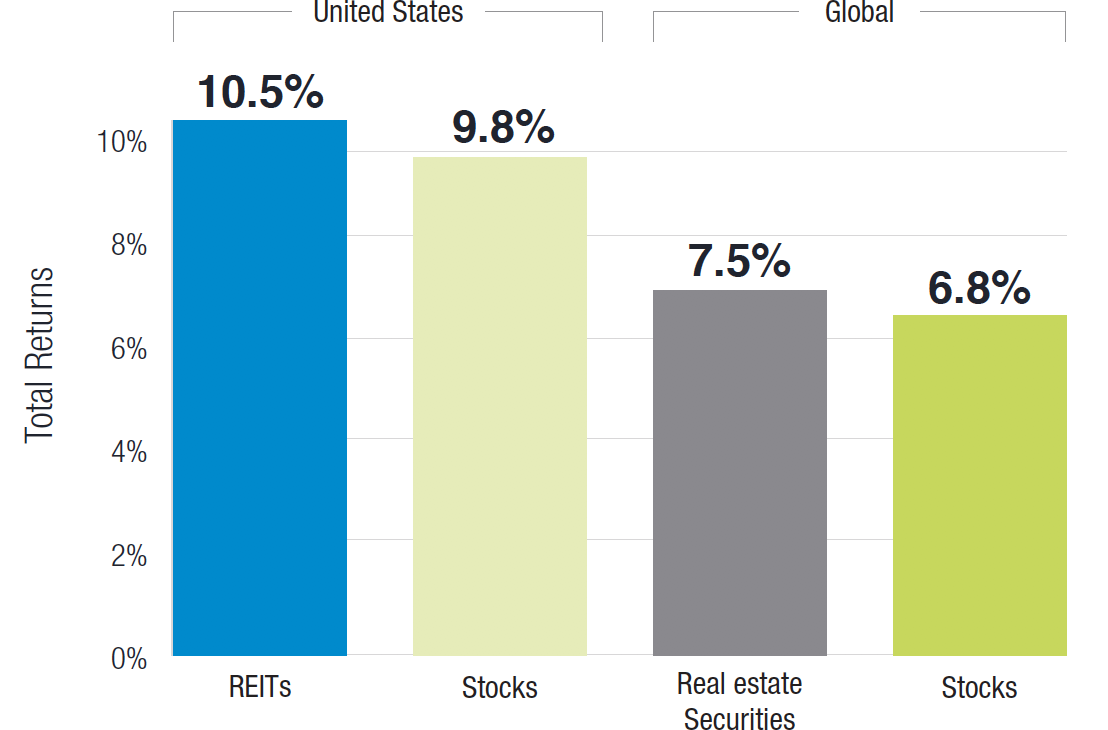
Source: Bloomberg and Morningstar. Data from December 29, 1989 to July 31, 2018. Data
quoted represents past performance, which is no guarantee of future results. The (rate of return or mathematical table) shown is used only to illustrate the effects of the compound growth rate and is not intended to reflect future values of a Starlight Capital investment fund (mutual fund, alternative investment fund or non-redeemable investment fund). The contribution of reinvested dividends is the difference between the total return and price return published by the index provider.
quoted represents past performance, which is no guarantee of future results. The (rate of return or mathematical table) shown is used only to illustrate the effects of the compound growth rate and is not intended to reflect future values of a Starlight Capital investment fund (mutual fund, alternative investment fund or non-redeemable investment fund). The contribution of reinvested dividends is the difference between the total return and price return published by the index provider.
As a result, the total returns from REITs are generally less volatile and more predictable than those of common equities. Adding them to a diversified portfolio usually results in more returns per unit of risk incurred, improving total portfolio risk-adjusted returns.
Efficient frontier with and without real estate
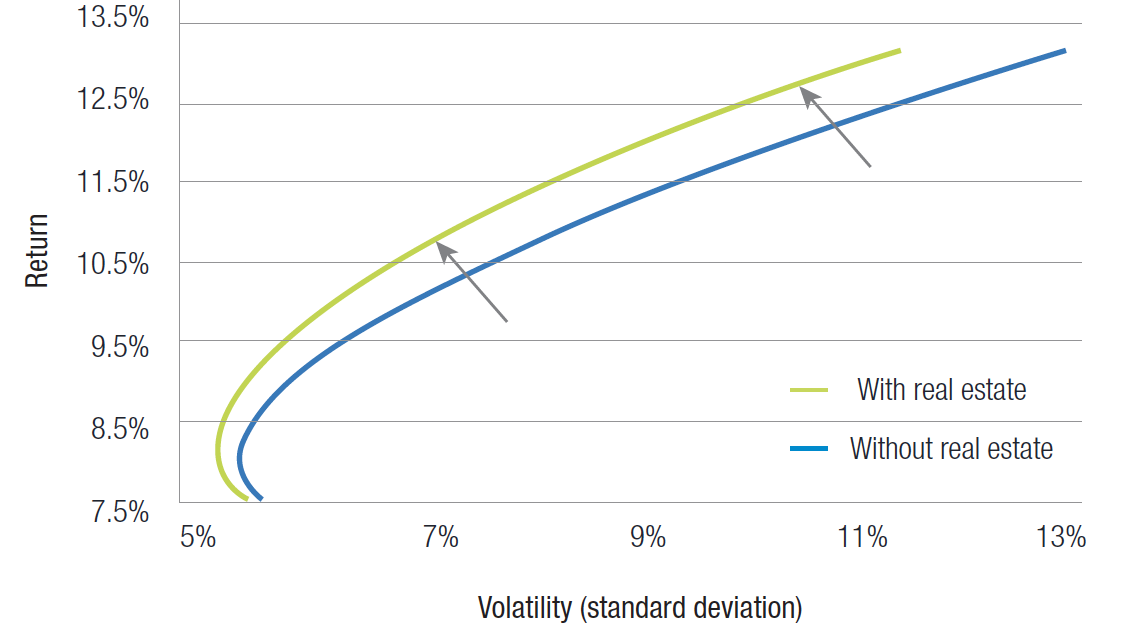
Source: The Prescott Group, LLC. For illustrative purposes only.
In 2016, the Global Industry Classification System (“GICS”) was expanded to include Real Estate as a standalone sector with a 2.7% weight in the S&P 500. In making this decision, MSCI and S&P Dow Jones noted the increased specialization of the Real Estate sector (13 sub-industries and two industry groups) and the low correlation of Real Estate returns with the rest of the Financials sector.
Many investors have done well investing in the S&P/TSX Capped REIT Index over the last several years. However, it’s important to note that Canadian REITs represent a very small fraction of the publicly-traded real estate available to investors. While the US still dominates at just over 52% of the FTSE EPRA NAREIT Developed Index (our benchmark), there is representation from over 20 different countries. At just 2.9% (19 total names), Canadian REITs are the seventh largest geographical allocation in this benchmark. By limiting themselves to Canadian REITs, investors are foregoing opportunities to own investment grade commercial real estate in world class cities such as New York, London, Paris, Singapore and Hong Kong. These are markets where supply is generally limited, and demand is usually robust, yielding rising real estate values and strong risk-adjusted returns. In addition, several global REIT sectors don’t exist in Canada (towers, datacenters, self-storage, student housing) and are only available to global REIT investors.
Many investors have done well investing in the S&P/TSX Capped REIT Index over the last several years. However, it’s important to note that Canadian REITs represent a very small fraction of the publicly-traded real estate available to investors. While the US still dominates at just over 52% of the FTSE EPRA NAREIT Developed Index (our benchmark), there is representation from over 20 different countries. At just 2.9% (19 total names), Canadian REITs are the seventh largest geographical allocation in this benchmark. By limiting themselves to Canadian REITs, investors are foregoing opportunities to own investment grade commercial real estate in world class cities such as New York, London, Paris, Singapore and Hong Kong. These are markets where supply is generally limited, and demand is usually robust, yielding rising real estate values and strong risk-adjusted returns. In addition, several global REIT sectors don’t exist in Canada (towers, datacenters, self-storage, student housing) and are only available to global REIT investors.
FTSE EPRA NAREIT developed index country and sectors

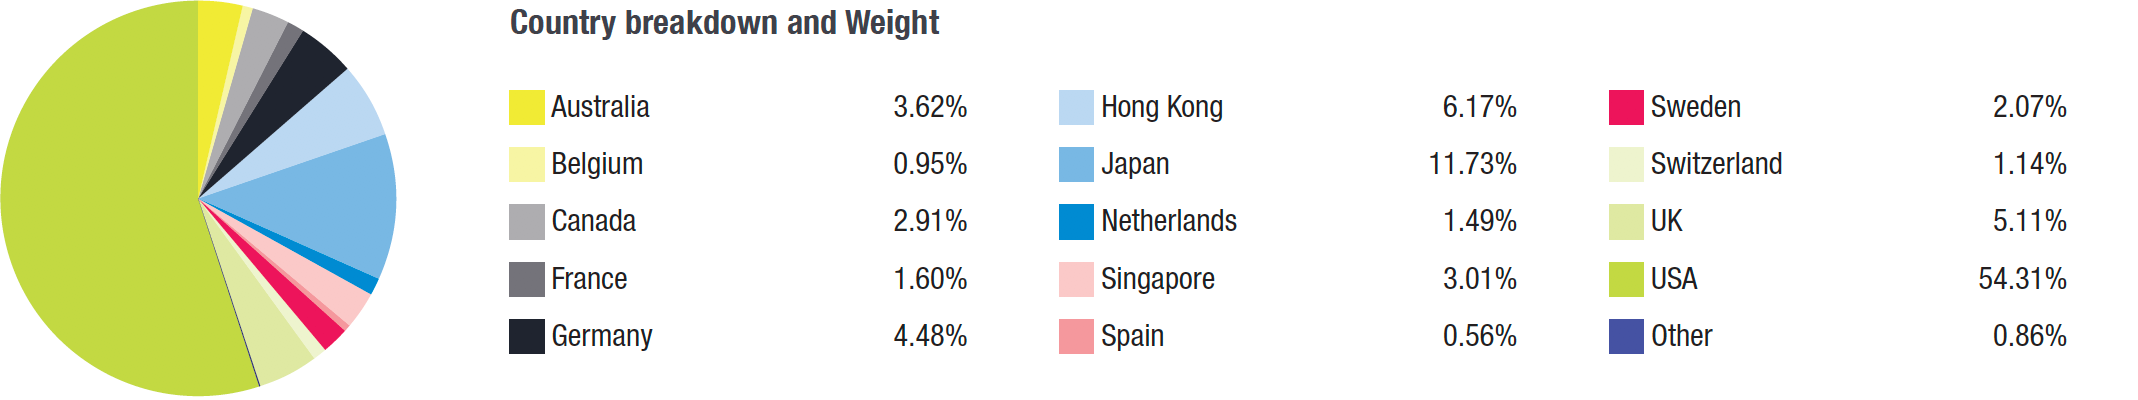
FTSE EPRA Nareit Developed Dividend+Index. FTSE Russell Factsheet. As at December 31, 2019.
Global REIT returns show strong evidence of mean reversion. As the chart below shows, often sectors or countries that were the poorest performers the year before, quickly rebound to be the top performers the next year. Allocating capital to undervalued real estate sectors and/or countries generally results in strong returns the following year. This characteristic of global REIT investing rewards a disciplined investment strategy predicated on valuation and patience.
Annual global real estate returns dispersion
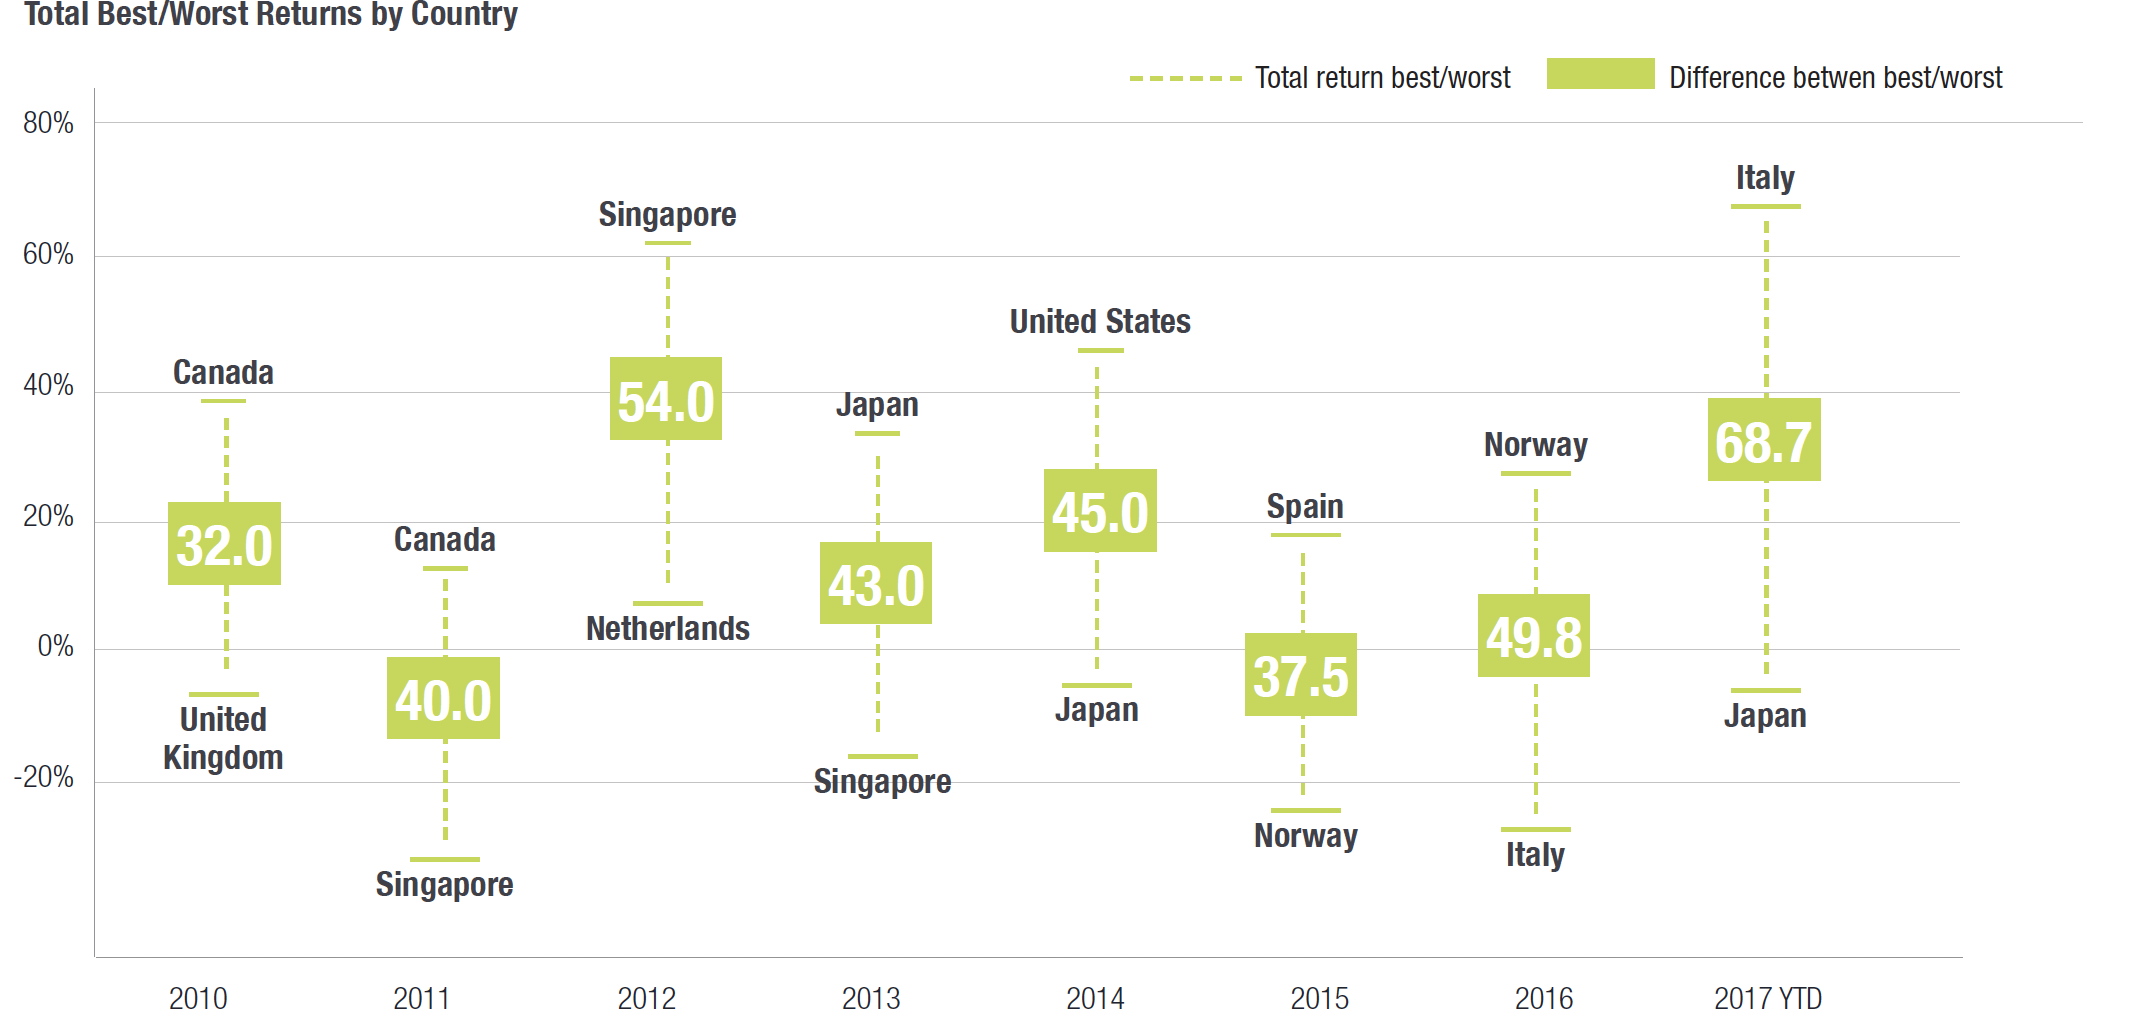
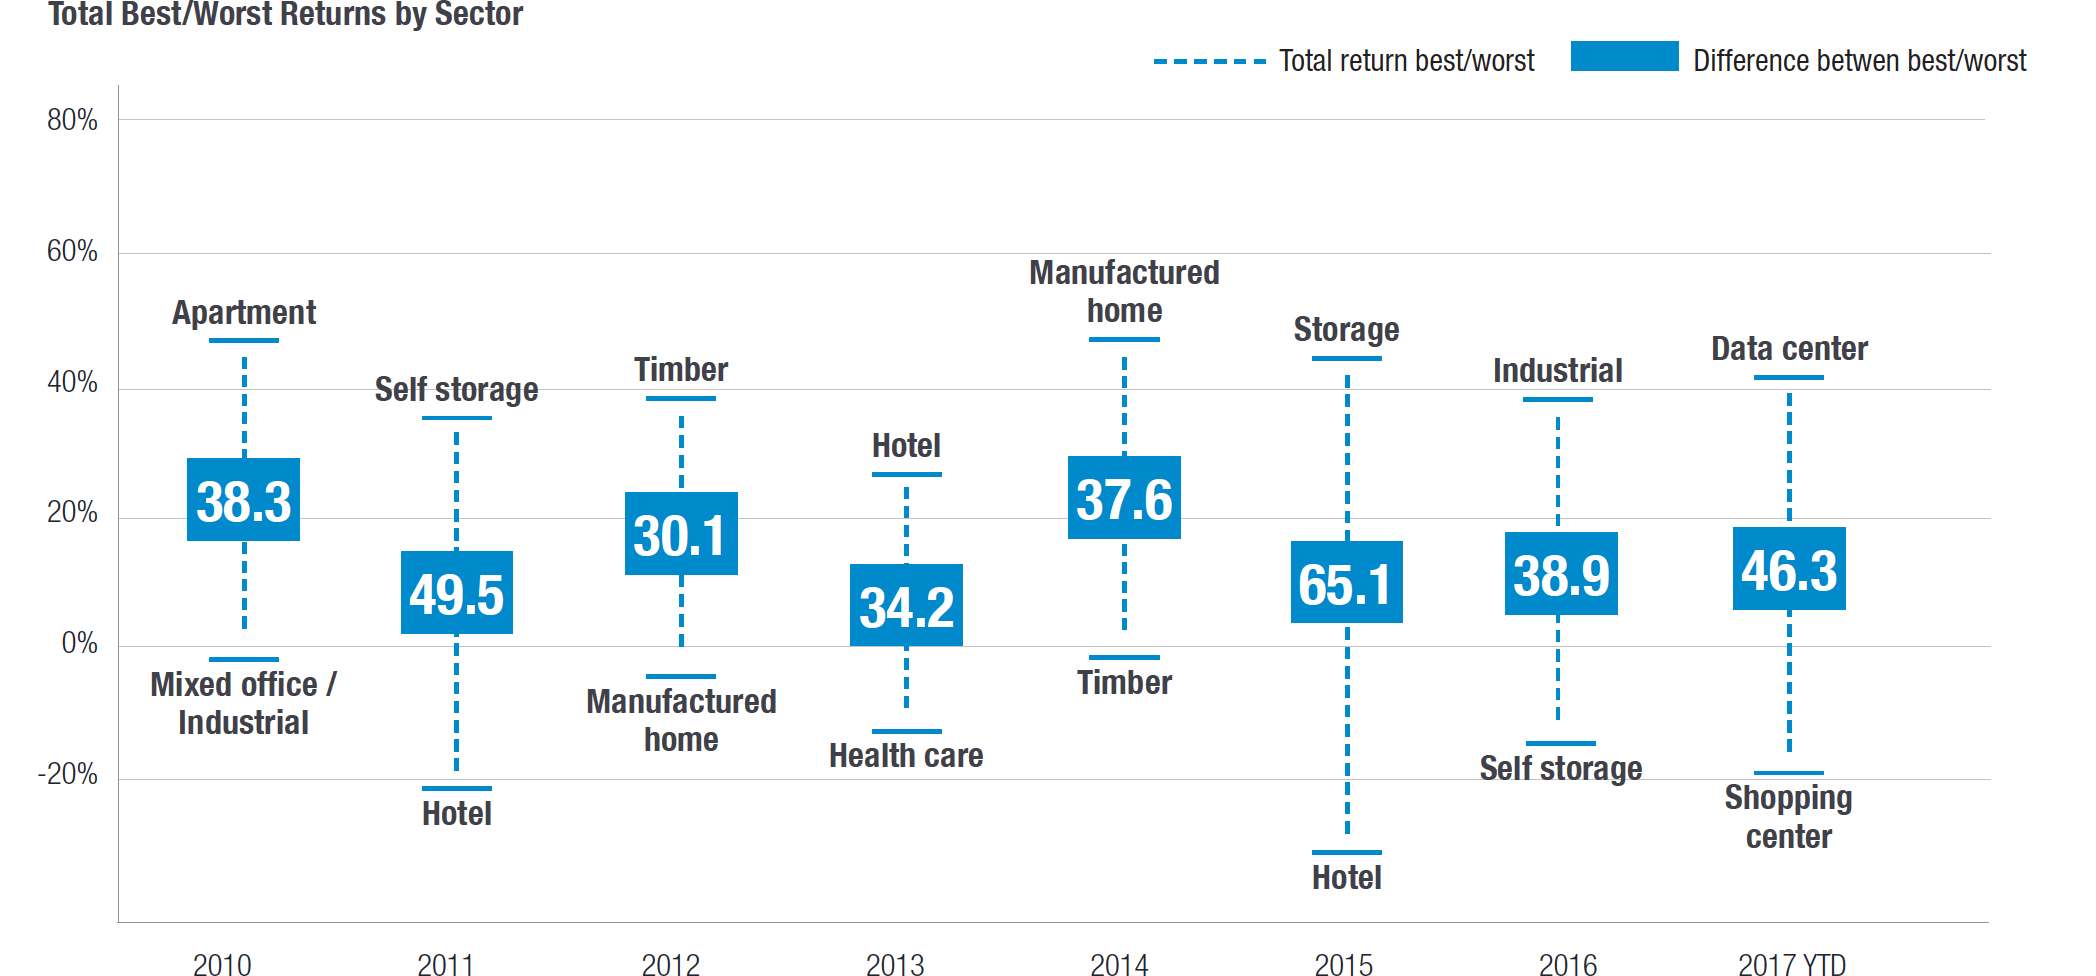
Source: Morningstar, Cohen & Steers.
Data quoted represents past performance, which is no guarantee of future results. The information presented above does not reflect the performance of any fund or account managed or serviced by Cohen & Steers, and there is no guarantee that investors will experience the type of performance reflected above. Property sector returns based on FTSE NAREIT Equity REIT Index. Country returns based on FTSE EPRA/NAREIT Developed Real Estate Index. As at August 31, 2017.
Data quoted represents past performance, which is no guarantee of future results. The information presented above does not reflect the performance of any fund or account managed or serviced by Cohen & Steers, and there is no guarantee that investors will experience the type of performance reflected above. Property sector returns based on FTSE NAREIT Equity REIT Index. Country returns based on FTSE EPRA/NAREIT Developed Real Estate Index. As at August 31, 2017.
Starlight Capital approach
At Starlight Capital, our goal is to add value by concentrating our invest- ments into high quality REITs with several value creation levers at their disposal. REITs with more growth potential should outperform through the cycle but their value is especially important when economic activity accelerates, and inflation expectations and spot rates rise. Purchased when they offer us sufficient return for the risk incurred these investments should yield us strong risk-adjusted returns over the long term.
Certain statements in this document are forward-looking. Forward-looking statements (“FLS”) are statements that are predictive in nature, depend upon or refer to future events or conditions, or that include words such as “may,” “will,” “should,” “could,” “expect,” “anticipate,” “intend,” “plan,” “believe,” or “estimate,” or other similar expressions. Statements that look forward in time or include anything other than historical information are subject to risks and uncertainties, and actual results, actions or events could differ materially from those set forth in the FLS. FLS are not guarantees of future performance and are by their nature based on numerous assumptions. Although the FLS contained herein are based upon what Starlight Capital and the portfolio manager believe to be reasonable assumptions, neither Starlight Capital nor the portfolio manager can assure that actual results will be consistent with these FLS. The reader is cautioned to consider the FLS carefully and not to place undue reliance on FLS. Unless required by applicable law, it is not undertaken, and specifically disclaimed that there is any intention or obligation to update or revise FLS, whether as a result of new information, future events or otherwise.
Commissions, trailing commissions, management fees and expenses all may be associated with mutual fund investments. Please read the prospectus before investing. Mutual funds are not guaranteed, their values change frequently and past performance may not be repeated. Starlight, Starlight Investments, Starlight Capital and all other related Starlight logos are trademarks of Starlight Group Property Holdings Inc.